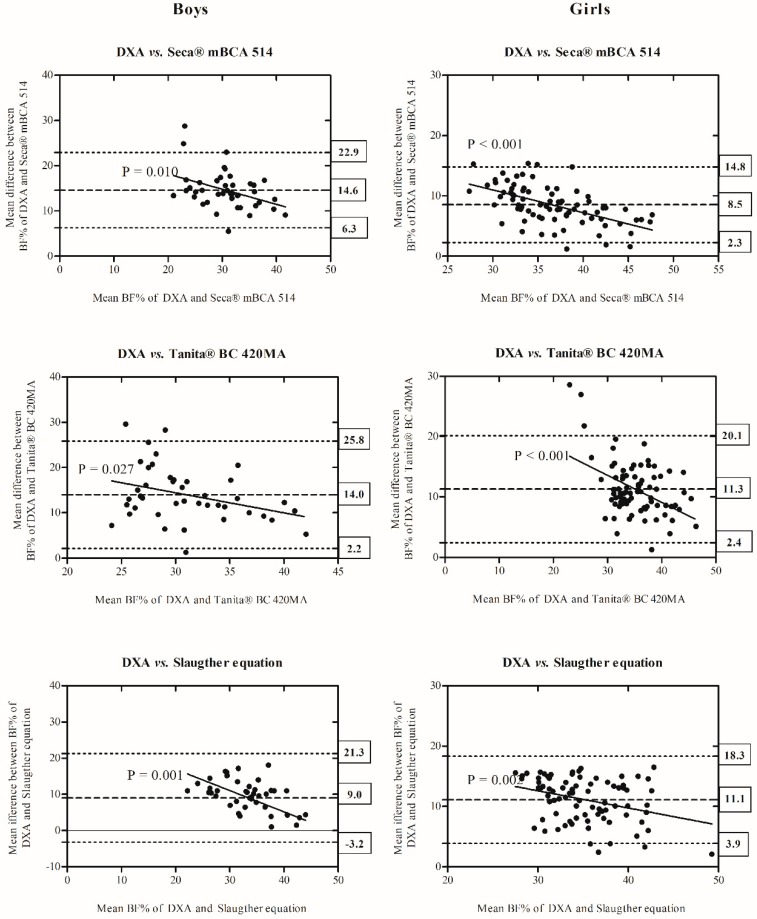
Figure 1.
Comparison of BF% measured by DXA in comparison with Seca® mBCA 514, Tanita® BC 420MA, and Slaughter equations and displayed as Bland–Altman plots in boys and girls. The central line represents the mean bias between measurements. Dotted lines represent upper and lower limits of agreement. Y-axis represents difference of BF% measured by DXA minus BF% measured by Seca® mBCA 514, Tanita® BC 420MA or from skinfolds, respectively. The solid line and equation in each plot represent the linear regression between biases and body fatness by each method (DXA vs. Seca® mBCA 514; DXA vs. Tanita® BC 420MA and DXA vs. Slaughter equations). Abbreviations: BF%: body fat percentage; DXA: dual energy X-ray absorptiometry.

