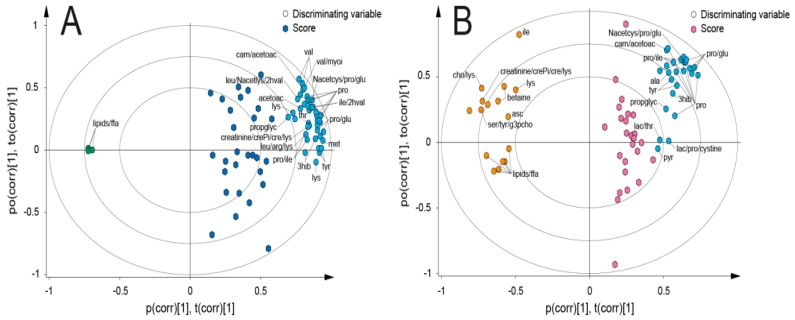
Figure 3.
Biplots in orthogonal projections to latent Structures with effect projection (OPLS-EP). Model (A) (n = 28) compared the difference between lacto-ovo vegetarian (LOV) and vegan (VE) breakfasts. Model (B) (n = 26) compared the difference between LOV and omnivore (OM) breakfasts. Both models included 196 variables. Scores (hexagon symbols) denote the calculated effect matrix in each individual. Dark blue = difference in metabolic response between LOV and VE. Pink = difference in metabolic response between LOV and OM. Labeled circles denote selected discriminating variables (metabolites) in the two models. Green = metabolites increasing in VE breakfast in relation to LOV breakfast. Blue = metabolites increasing in LOV breakfast in relation to VE and OM breakfasts. Red = metabolites increasing in OM breakfast in relation to LOV breakfast.

