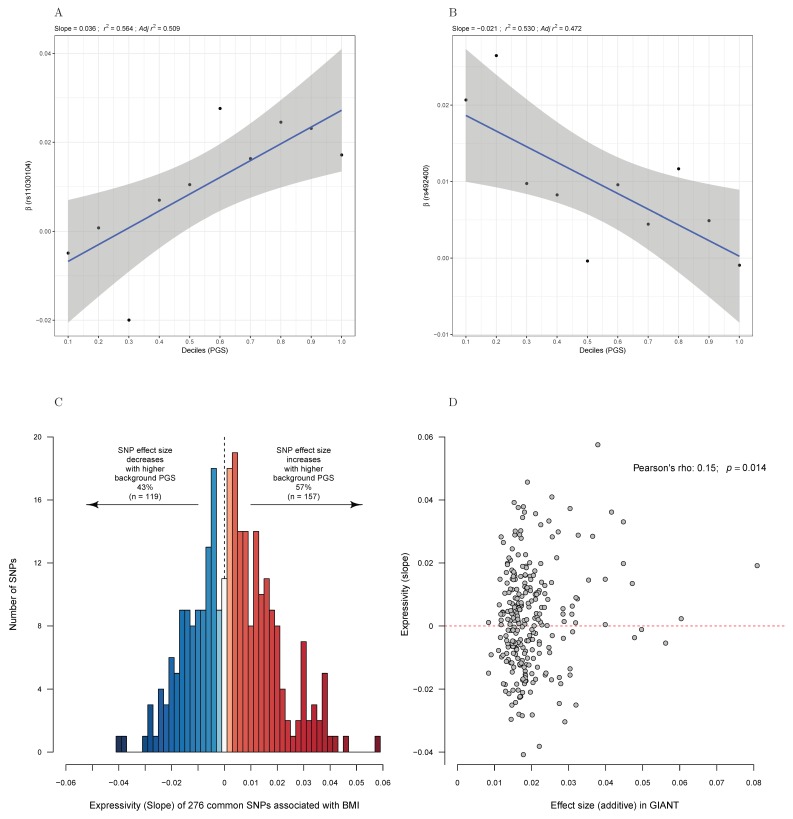
Figure 3.
Allele expressivity of BMI variants changes according to the genetic background. The effect of BMI-associated variants tends to increase in more obesogenic genetic backgrounds. (A) Effect of rs11030104 on BMI for different deciles of a PGS combining the allele counts per individuals for 276 common variants associated with BMI (see Methods Section 2.5 Expressivity Analyses). (B) The corresponding allele expressivity slope for rs492400 is negative, indicating that the BMI-increasing allele does indeed lower it in individuals with a strong obesity-predisposing genetic background. (C) Histogram depicting the estimate of allele expressivity slopes for the 283 SNPs associated with BMI. The significant trend towards positive slopes (in red) implies that variants associated with BMI tend to exert stronger effects in individuals with higher PGS. (D) Scatterplot depicting for each variant the effect size on BMI in the GIANT study (X-axis) against the allele expressivity slope observed in the UK Biobank (Y-axis). These variables are positively correlated (Pearson correlation coefficient r = 0.15, p = 0.014), particularly at variants with stronger effects on BMI.

