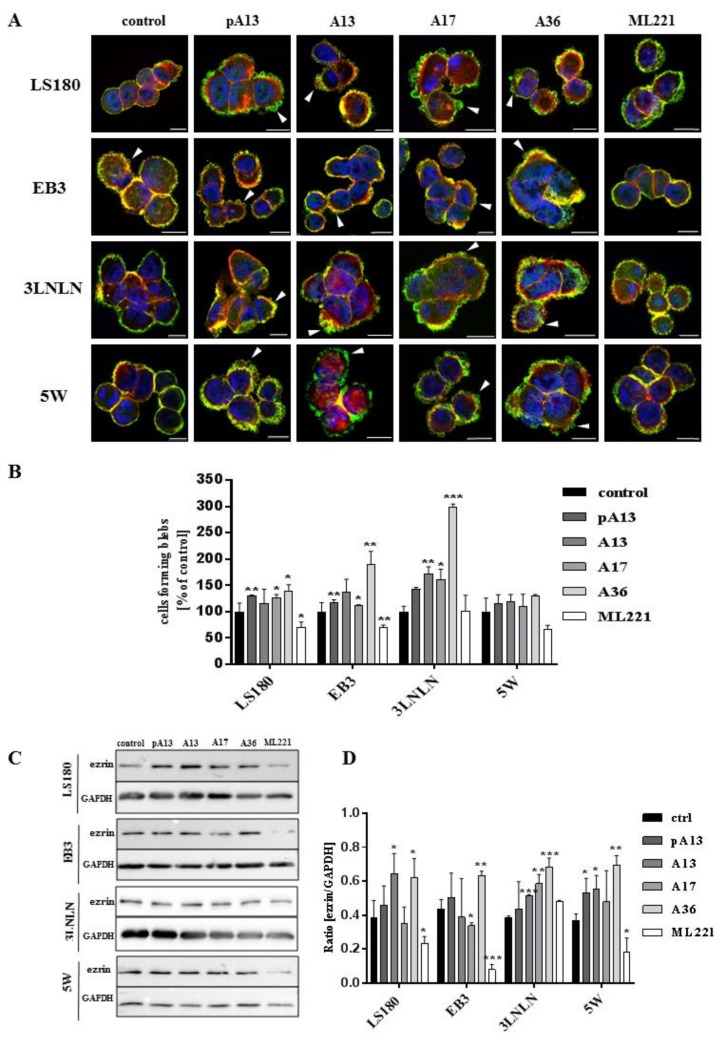
Figure 2.
Influence of apelin on blebs formation. (A) Representative localization of ezrin (green), filamentous actin (red) and nuclei (blue) in colon cancer cells after apelin peptides (100 nM) or ML221 (100 nM) stimulation. Arrowheads indicate migratory protrusions. Scale bars represent 10 μm; (B) Quantification of the number of cells forming blebs after apelin peptides or ML221 treatment, shown as a percent of control cells. Results are expressed as the mean (cells forming blebs) ± SD of three independent experiments. p ≤ 0.05 (*), p ≤ 0.01 (**), p ≤ 0.001 (***). Representative Western blot; (C) and densitometric (D) analysis for level of ezrin in tested cells incubated with apelin peptides or ML221. The GAPDH level was shown as a loading control. Results are expressed as the mean ± SD of three independent experiments. p ≤ 0.05 (*), p ≤ 0.01 (**), p ≤ 0.001 (***).

