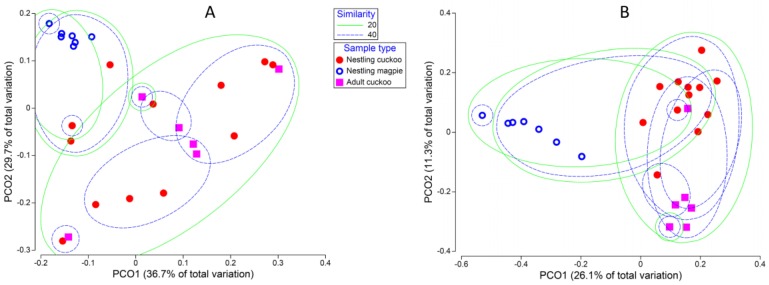
Figure 2.
Differences in whole composition of the cloaca microbiota among cuckoo nestlings, magpie nestlings, and adult cuckoos. (A) Distances based on weighed unifrac β-diversity; (B) Distances based on unweighed unifrac β-diversity. Lines surround samples clustered by percentage of similarity (20% or 40%) among their whole microbial communities. PCO2: second principal coordinate axis; PCO1: first principal coordinate axis.

