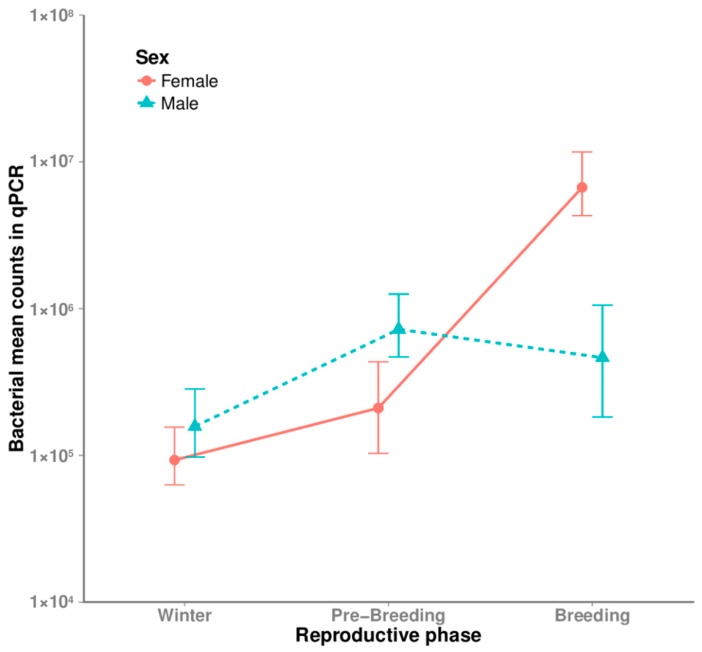
Figure 3.
Interaction plot showing quantitative polymerase chain reaction (qPCR) results for bacterial counts per microliter of uropygial secretion. Bacterial density mean and standard deviation are represented for different reproductive phases of females (winter N = 2, pre-breeding N = 5, breeding N = 5) and males (winter N = 2, pre-breeding N = 5, breeding N = 5).

