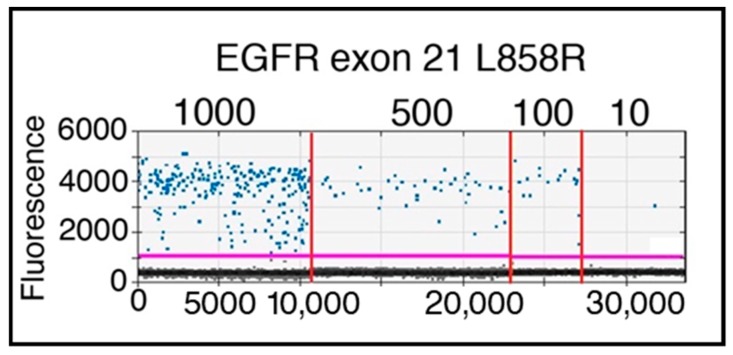
Figure 6.
1-D plot showing ddPCR results of spike-in samples performed with H1975 mutated cell line in healthy donor blood sample. The ordinate scale indicates fluorescence intensity. The magenta line is the fluorescence-threshold, above which droplets (blue) containing EGFR p.L858R mutated copies are present. Serial dilutions, from 1000 to 10 H1975 cells, are separated by the vertical red lines.

