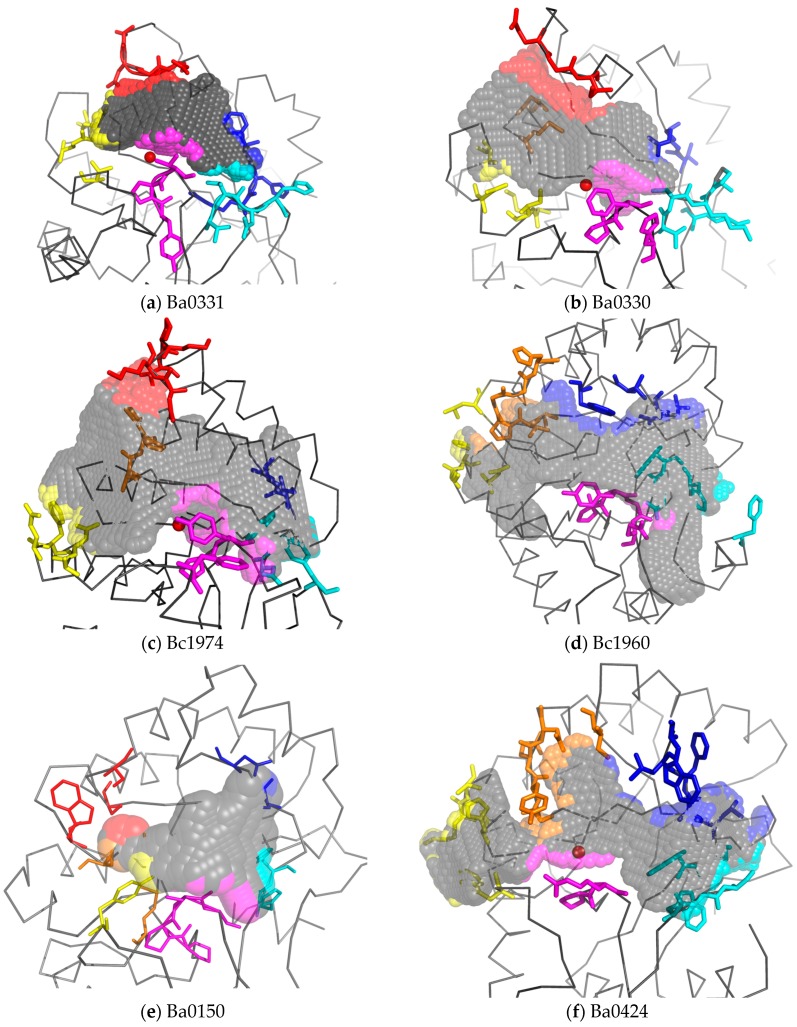
Figure 8.
Cavity volumes of the substrate binding grooves of experimentally determined PDAs. The volume of the cavity extending on each side of the zinc ion is represented with grey spheres. The domains that set the outer boundaries of the binding groove are coloured in blue, cyan, magenta, yellow, orange, or red in accordance with Figure 4 and their corresponding amino acid residues are shown in sticks. Where applicable, the zinc ion is represented as red balls. Despite the overall similar fold of all NodB domains, the relative analysis revealed profound variation between the Fn3-containing PDAs Ba0331 (a) and Ba0330 (b) as well as between the highly homologous Bc1974 (c) and Bc1960 (d). The non-metal containing Ba0150 (e) has a rather small and deep crevice, while the cavity of the putative MurNAc deacetylase Ba0424 (f) contains a restriction ring at the post-MT1 region (coloured orange).

