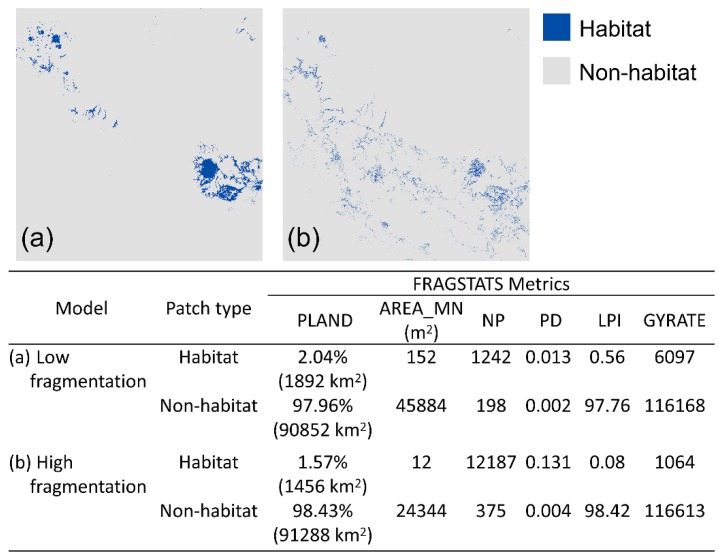
Figure 3.
Habitat and non-habitat binary maps predicted by (a) low-fragmentation [55] and (b) high-fragmentation models [56] using a 0.2 suitability threshold. FRAGSTATS metrics that characterizes fragmentation of habitat and non-habitat patches of the two models are shown in bottom table. PLAND: percentage of landscape, AREA_MN: mean patch size, NP: number of patches, PD: patch density, LPI: largest patch index, and GYRATE: radius of gyration of patches.

