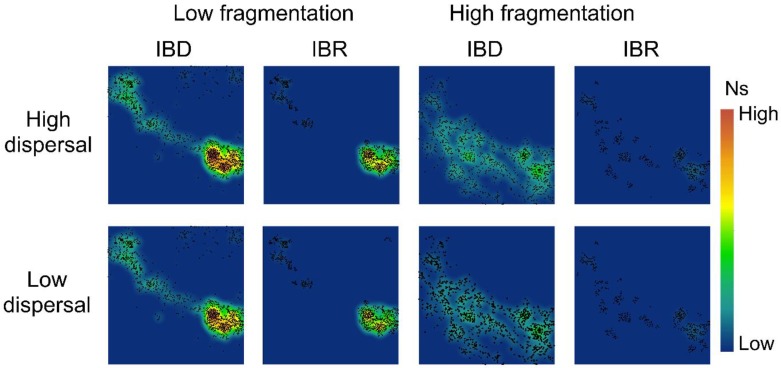
Figure 4.
Spatial patterns of effective population size (Ns) in the low-fragmentation model (left two columns) and the high-fragmentation model (right two columns). IBD: isolation-by-distance. IBR: isolation-by-resistance. Top row: high-dispersal scenario (300 km). Bottom row: low-dispersal scenario (200 km). Black marker represents occupied nodes at the 100th generation of simulation.

