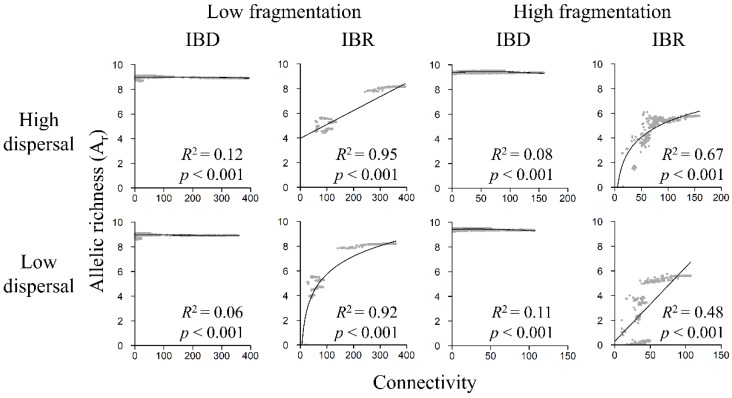
Figure 8.
Relationship between Ar and landscape connectivity in the low-fragmentation model (left two columns) and the high-fragmentation model (right two columns). Top row: high-dispersal scenario (300 km). Bottom row: low-dispersal scenario (200 km). Allelic richness (y-axis) is calculated with software sGD. Connectivity (x-axis) is quantified in terms of cumulative resistant kernel density, representing the expected density of dispersing individuals. Gray markers represent the mean of 100 Monte Carlo simulation runs for each node. Adjusted R2 and p-value are shown.

