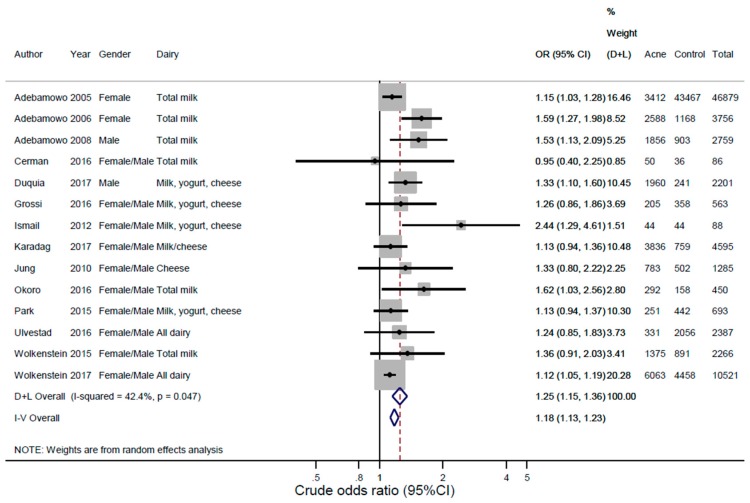
Figure 2.
Meta-analysis of dairy intake and acne vulgaris: individual studies. The figure shows the individual studies and the unadjusted pooled random effect estimate from the meta-analysis of dairy intake and acne vulgaris. I2(%): I-square heterogeneity expressed as percentage. p-value(het): p-value from Cochran’s Q-statistic assessing heterogeneity. D + L: DerSimonian and Laird pooled random effects estimates. See Table 1 for references.

