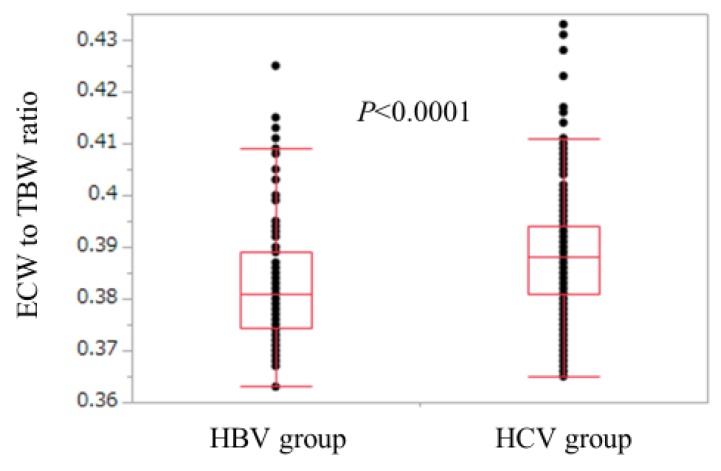
Figure 1.
Comparison of ECW/TBW in the HBV group and the HCV group. ECW/TBW in the HCV group ranged from 0.365 to 0.433 (median, 0.388), while that in the HBV group ranged from 0.363 to 0.425 (median, 0.381). (p < 0.0001). HBV: hepatitis B virus; HCV: hepatitis C virus; ECW: extracellular water; TBW: total body water.

