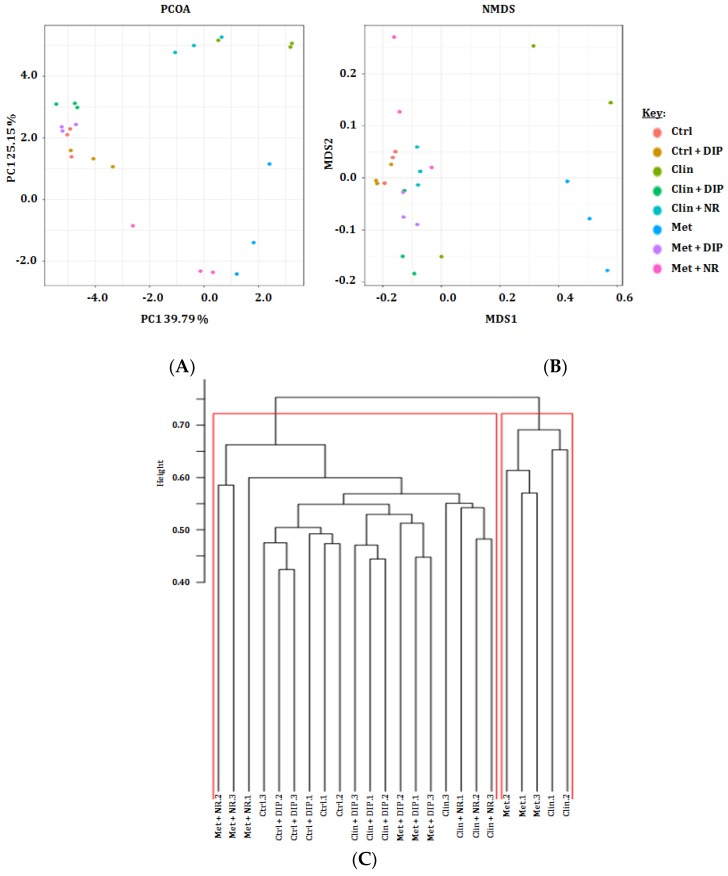
Figure 4.
The representative graphical output of the beta diversity indices. (A) Principal coordinate analysis (PCoA) plot, (B) Non-metric multidimensional scaling plot (NMDS) with Bray–Curtis dissimilarity showing the distribution of the mice fecal samples based on the phylogenetic makeup of their microbiota. Each sample is represented by a dot in the graph, while different treatment groups are represented by different colors (n = 3). The distance between the points represents the level of difference; the closer the samples are, the higher the similarity between them. (C) Hierarchical cluster dendrogram representing similarities or dissimilarities between different treatment groups (n = 3 per group). Distance is shown on the scale bar.

