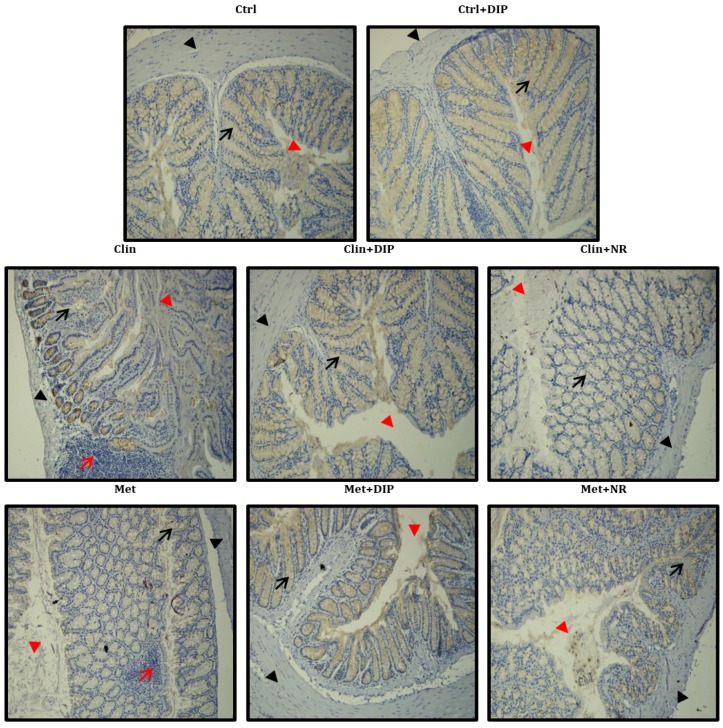
Figure 9.
Representative immunohistochemistry staining for Mucin-2 in the colon of eight different treatment groups. Shown are mucin expression (indicated with black arrows), inflammatory cells (red arrows), the mucosal space (red arrow head), and the epithelium surface (black arrow head). Original magnification ×20, Scale bar: 100 µm.

