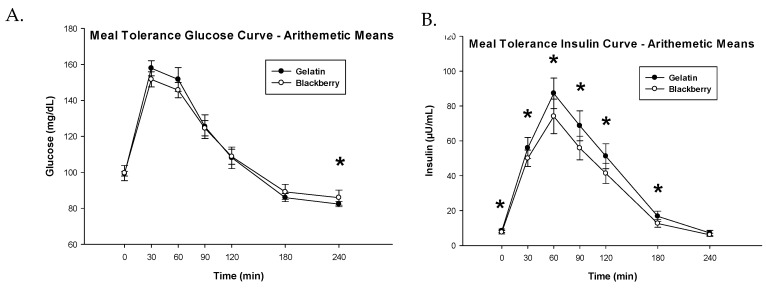
Figure 3.
Blood glucose (A) and insulin (B) concentrations as a function of time after administration of the meal-based glucose tolerance test including either blackberries or gelatin. Asterisks indicate significant differences between the gelatin and blackberry diet treatments, p < 0.05. Time-response curves are arithmetic means ± SE. n = 24 subjects.

