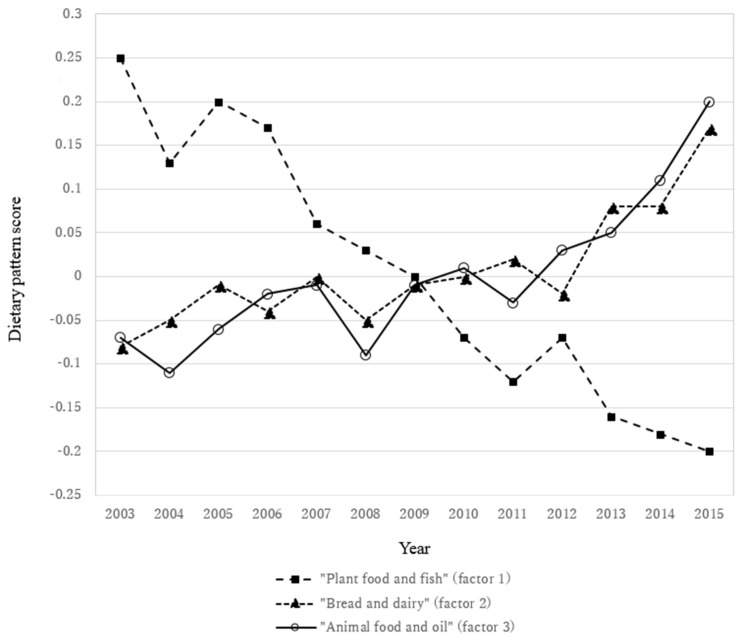
Figure 2.
Thirteen-year trends in dietary pattern scores in adults aged ≥20 years in the National Health and Nutrition Survey, Japan 2003–2015. Values are means adjusted for sex, age category, occupation, weight status, and current smoking. The dietary pattern score represents standardized variables with mean 0 and standard deviation 1. Negative scores indicate low adherence to the dietary pattern, and positive scores indicate high adherence. The naming of the dietary patterns was as follows: “plant food and fish” (factor 1), “bread and dairy” (factor 2), and “animal food and oil” (factor 3). Sizes of the study population were as follows: n = 7062 for 2003, n = 5675 for 2004, n = 5469 for 2005, n = 6062 for 2006, n = 5954 for 2007, n = 6198 for 2008, n = 6047 for 2009, n = 5581 for 2010, n = 5197 for 2011, n = 19,717 for 2012, n = 5393 for 2013, n = 5298 for 2014, and n = 4874 for 2015. The trends in all dietary patterns were significant (p for trend < 0.0001).

