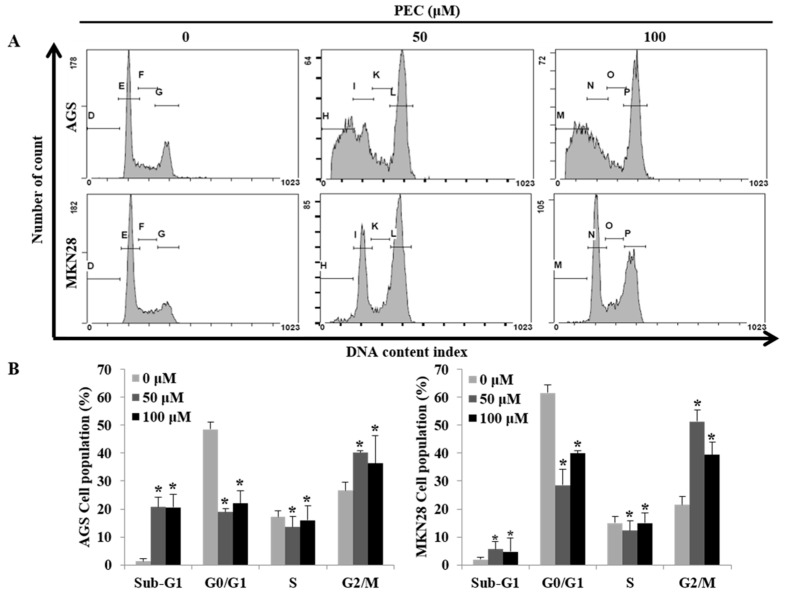
Figure 2.
Flow cytometric analysis of cell cycle progression after PEC treatment and its regulatory mechanism. AGS and MKN28 cells were treated with indicated concentrations of PEC for 24 h. (A,B) Cell cycle distribution was determined by flow cytometry. The data were analyzed using CXP Software. (C) Effect of PEC on cell cycle-related proteins (cyclin B1, CDK1, and CDC25C) expression level in AGS and MKN28 cells. Cells were treated with PEC (0, 50 and 100 μM) for 24 h. Cell lysates were subjected to sodium dodecyl sulfate polyacrylamide gel electrophoresis (SDS-PAGE) and analyzed by Western blotting. Representative blots are shown. (D) qRT-PCR results show a significant difference in p53 and p21 mRNA levels in both AGS and MKN28 cells. The Bar indicates RNA expression normalized to β-actin. Results are expressed as the mean ± standard deviation (SD) of at least three independent experiments. Statistical differences were analyzed with Student’s t-test (* p < 0.05 vs. control).


