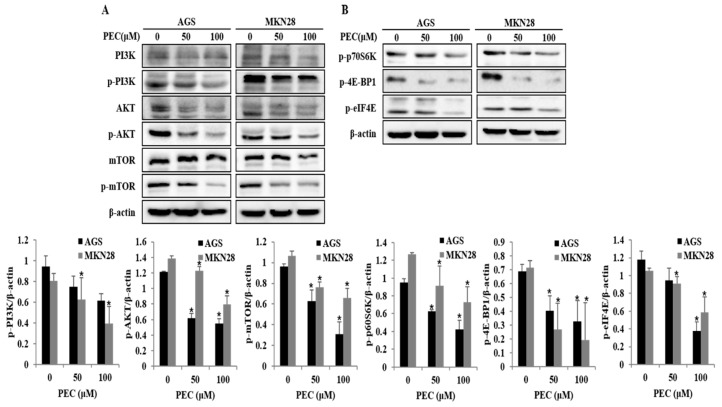
Figure 6.
Effect of PEC on inhibition of PI3K/AKT/mTOR pathway. (A,B) AGS and MKN28 were treated with indicated concentrations of PEC or 24 h. The cell lysates were subjected to SDS-PAGE and analyzed by immune-blotting. Densitometry analyses of p-PI3K, p-AKT, p-mTOR, p-p70S6K, p-4E-BP1 and p-eIF4E protein expressions are presented as the mean ± standard deviation (SD) of at least three independent experiments. Statistical differences were analyzed with Student’s t-test (* p < 0.05 vs. control).

