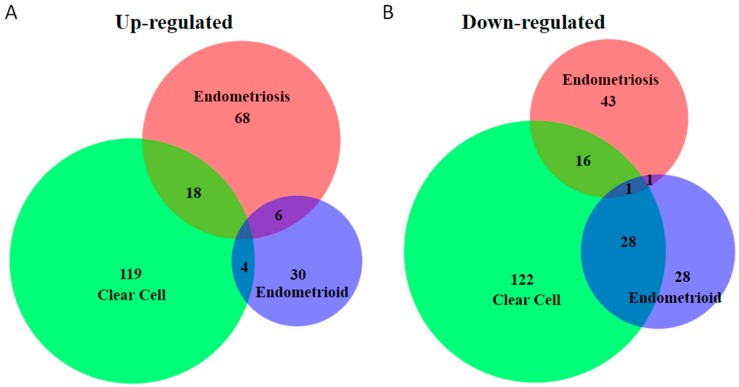
Figure 2.
Venn diagram of overlap of number of miRNAs differentially expressed in endometriosis and ovarian clear-cell and endometrioid adenocarcinoma. The miRNAs differentially expressed are depicted in three overlapping circles. The numbers indicate the miRNA counts that are unique or in common between the groups. (A) Upregulated miRNAs; (B) downregulated miRNAs. Supplemental Table S1 details the miRNAs in each group above.

