Figure 4.

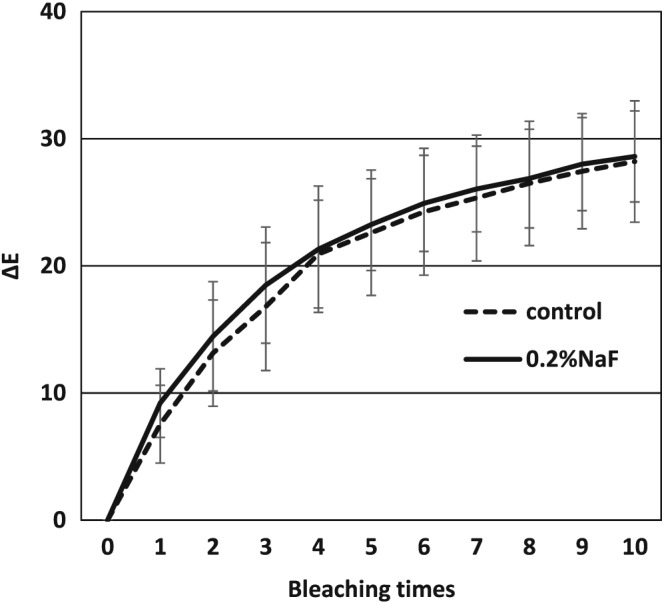
ΔE changes after bleaching between control group and NaF group. No significant difference was observed between the two groups to the figure legend. NaF: sodium fluoride

ΔE changes after bleaching between control group and NaF group. No significant difference was observed between the two groups to the figure legend. NaF: sodium fluoride