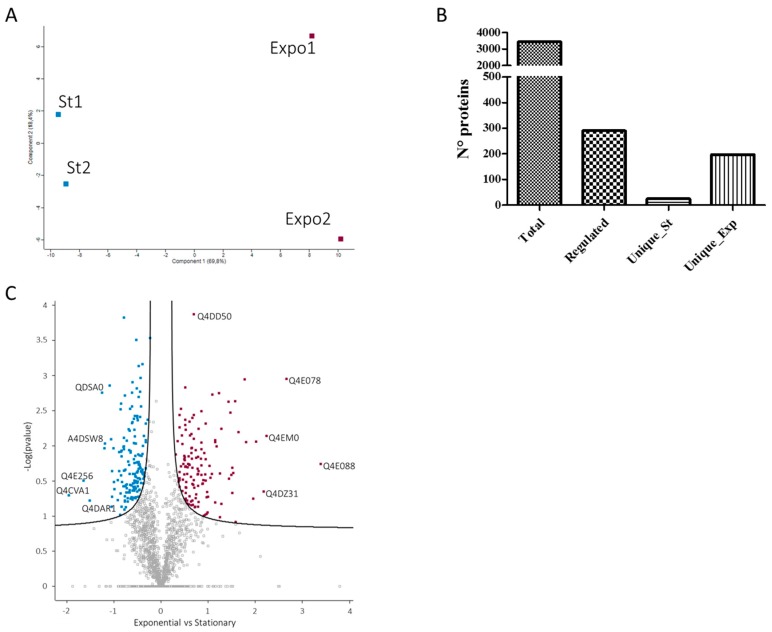
Figure 4.
Quantitative analysis of proteins identified in the T. cruzi exponential and stationary phases. (A) Principal component analysis (PCA) analysis of label-free quantification (LFQ) values for the two biological replicates of exponential (Expo1 and Expo2) and stationary (St1 and St2) phases. (B) Number of total, regulated and unique proteins identified. (C) Volcano plot (Log2 (Exponential)-Log2 (Stationary) vs. –Log10 (p-value)) of quantified proteins in the exponential and stationary phases. Purple dots represent proteins upregulated in the exponential phase, while blue dots represent proteins upregulated in the stationary phase.

