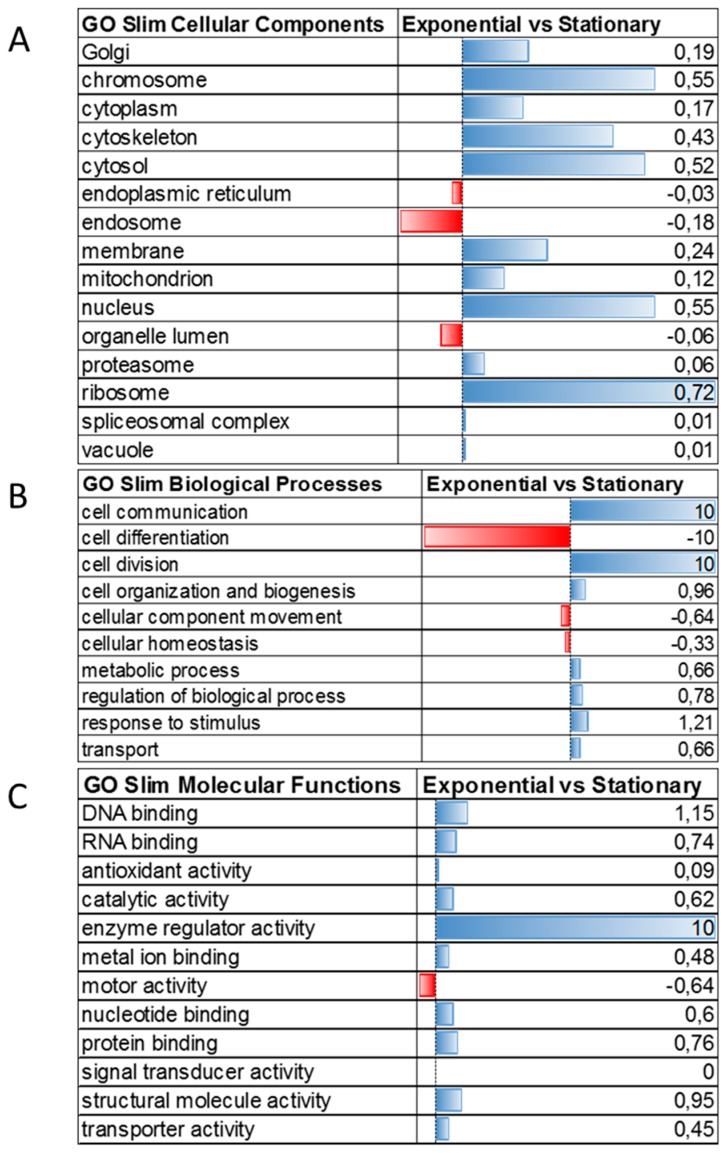
Figure 6.
Gene ontology analysis combined with quantitative data of proteins differentially expressed between T. cruzi exponential and stationary phases. (A) Cellular components, (B) Biological processes and (C) Molecular functions of regulated proteins. Blue bars represent proteins upregulated in the exponential phase, while red bars represent proteins upregulated in the stationary phase.

