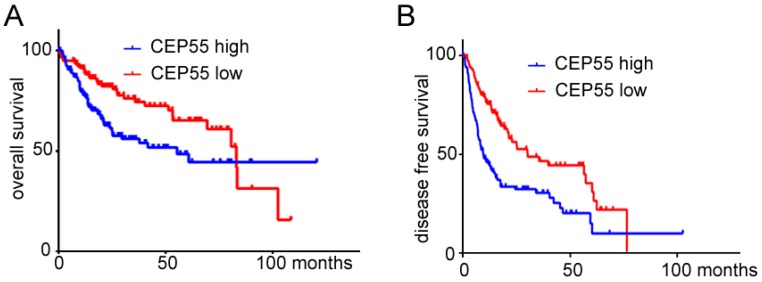
Figure 2.
The prognostic effects of high and low expression of CEP55 in HCC patients. (A,B) Expression data of CEP55 and clinical data of HCC patients were obtained from Cbioportal. Patients were separated into two groups equally based on log2-transformed expression of CEP55, and % overall survival (A); or disease-free survival (B) vs. time was plotted. For the OS curves, N = 294, Log-rank test p = 0.0048, HR = 1.817 (1.200–2.735); for the DFS curves N = 260, Log-rank test p < 0.0001, HR = 2.090 (1.520–2.972).

