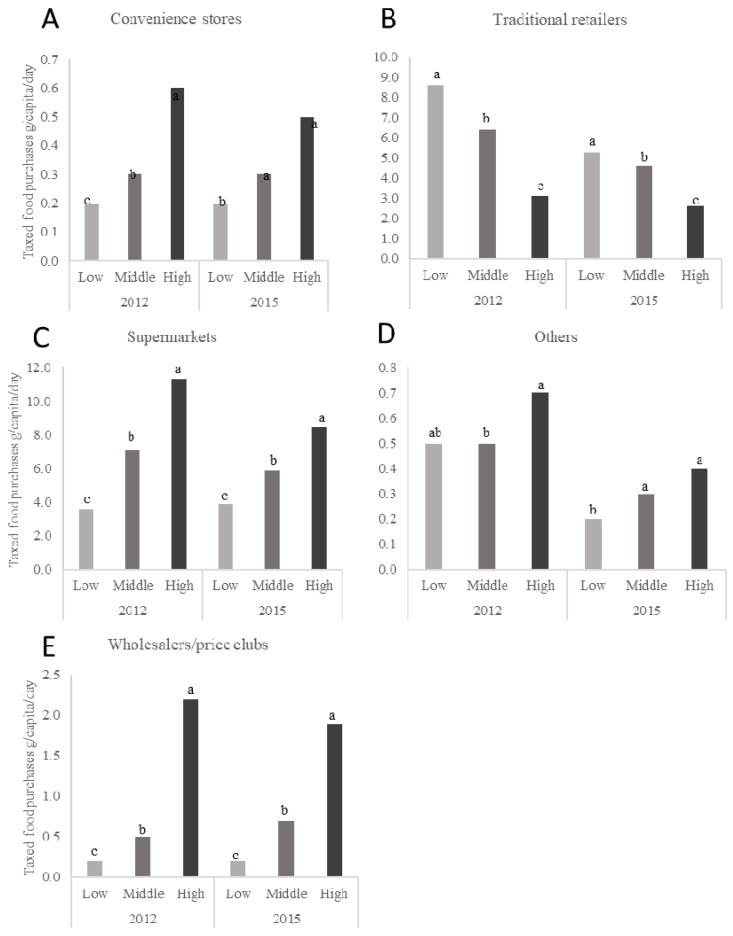
Figure 3.
Daily per capita purchases of taxed foods in urban Mexican households, according to SES, for the years 2012 and 2015. n = 959 in the low-SES, n = 3133 in the medium-SES, and n = 1721 in the high-SES group in 2012 and n = 1170 in the low-SES, n = 2690 in the medium-SES, and n = 1633 in the high-SES group in 2015. Subgraphs refer to taxed food purchases by store-type including (A) convenience stores, (B) traditional retailers, (C) supermarkets, (D) home water-delivery, and (E) wholesalers and price clubs. Values represent weighted unadjusted means. SES classification is based on the socioeconomic index provided by Nielsen. Multivariate linear regression models were used to predict per capita daily purchases of taxed foods according to store-type, SES, and year of purchases. Data presented are restricted to the Nielsen CPS purchasing information for 2012 and 2015 only for clarity. However, p-values represent the p-trend for years 2012, 2013, 2014, and 2015. Labeled means with a different letter represent significant differences between the SES categories means (p-trend < 0.05) where the letters a,b,c are used to differentiate the highest, middle, and lowest mean values for each figure in the panel. Source: Authors’ own analyses and calculations based on data from Nielsen through its Mexico Consumer Panel Service (CPS) for the food and beverage categories for January 2012 to December 2015. The Nielsen Company, 2016. Nielsen is not responsible for and had no role in preparing the results reported in this study.

