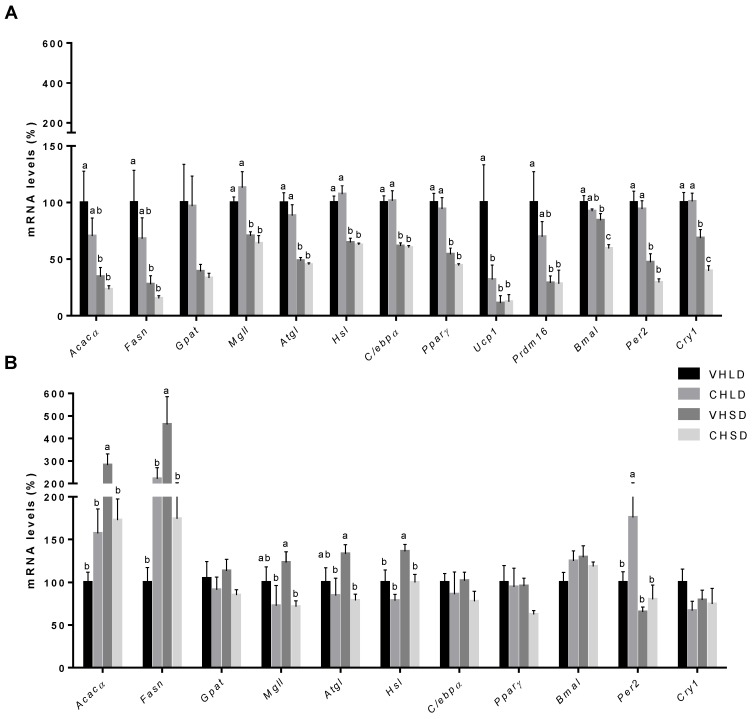
Figure 2.
mRNA expression levels in RWAT of Fischer 344 rats supplemented with a cherry (CH) lyophilizate or vehicle (VH), held in long-day (LD) and short-day (SD) photoperiods, and fed either with a standard (STD) (A) or a cafeteria (CAF) (B) diet in two independent experiments. Expression of genes related to lipogenesis, lipolysis, adipogenesis, thermogenesis, and the molecular clock. Data are presented as the ratios of gene expression relative to β-actin, Ppia, and Hprt genes and expressed as a percentage of the LD group set at 100%. Data are presented as the mean ± SEM, and the four groups were compared with a one-way ANOVA test (p < 0.05) followed by a Duncan’s new multiple range test (MRT) post hoc test. abc Mean values with unlike letters differ significantly among groups.

