Figure 3.
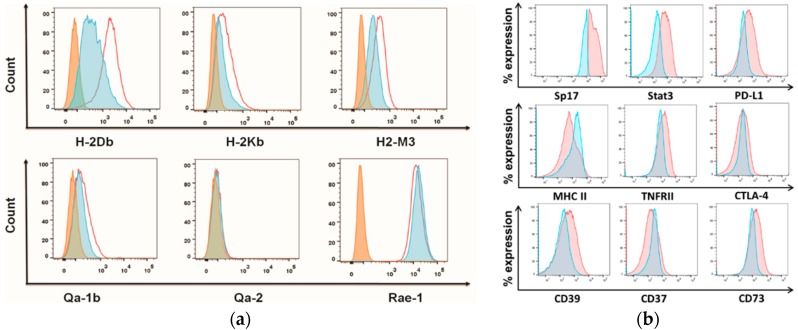
Sp17 expression modulates major histocompatibility class (MHC) expression and correlates with immunosuppressive molecules in ID8 cells. (a) Classical and non-classical MHC I molecule expression (H2-Db, H2-Kb, H2-M3, Qa-1b, Qa-2, and ribonucleic acid export 1 (rae-1)) in Sp17+ and Sp17− ID8 cells. Data is shown as histograms of each marker relative expression on Sp17+ (red unshaded) and Sp17− (blue) ID8 cells, as well as isotype control (orange); (b) Immunosuppressive molecules expressions (PD-L1, MHCII, CD39, CD37, CD73, cytotoxic T lymphocyte associated antigen-4 (CTLA-4), tumor necrosis factor receptor II (TNFRII), and STAT3) on gated Sp17+ and Sp17− ID8 cells. The Sp17+ and Sp17− ID8 cells (for Figure 3a) or un-fractionated ID8 cells (for Figure 3b) were stained with specific antibodies for each immune marker assessed here and analyzed by flow cytometry (see Materials and Methods). Data is shown as histograms for each marker-relative expression in Sp17+ (red) and Sp17− (blue) ID8 cells, as well as isotype control (orange). The X-axis shows the fluorescence intensity, and Y-axis shows count (a) or % expression normalized to mode (as a percent expression relative to each population) (b). Results are representative of three independent experiments.

