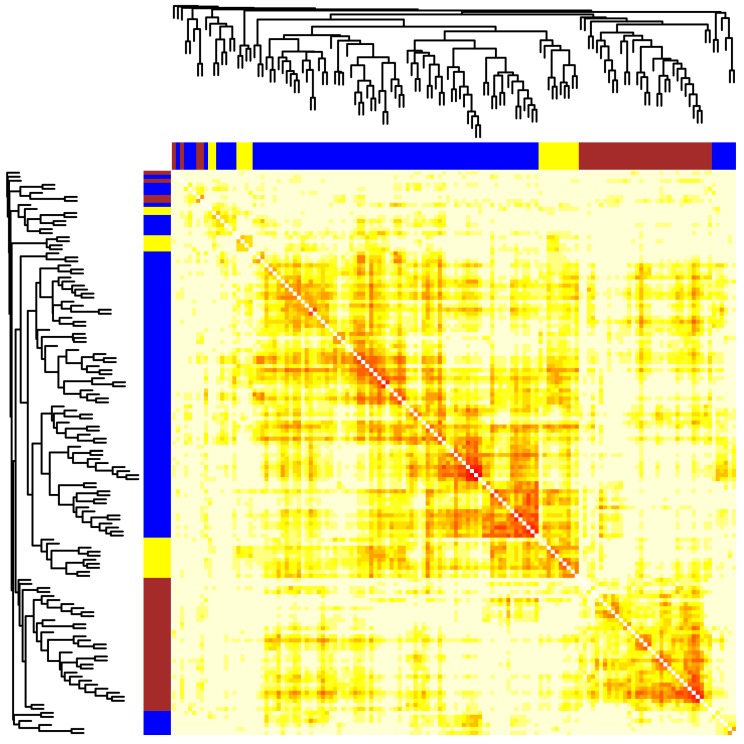
Figure 1.
Clustering of epithelial to mesenchymal transition (EMT), phosphatidylethanolamine binding (PEB) and autophagy genes by their pairwise distances. Pairwise topological overlap matrix (TOM) similarities of PEB, EMT and autophagy genes (n = 142) were calculated from their expression values in the GSE3325 dataset. Distances between each pair of genes were derived as 1-TOM and shown as color values (small, red or large, yellow). A hierarchical tree and colored segments of the clusters were shown on the top and side.

