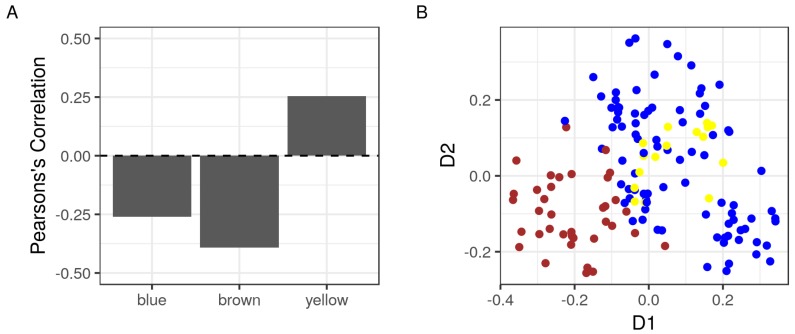
Figure 2.
Correlations of detected modules to the sample phenotype and to each other. The expression values of the members of detected modules in the GSE3325 dataset (87, blue; 37, brown; and 18, yellow) were used to calculate the principal component (PC) for each module as a whole. (A) the Pearson’s correlations of the modules’ first PC and the phenotype of the samples of origin; and (B) the first (D1) and second (D2) PC of three modules shown as points. Colors represent the corresponding modules.

