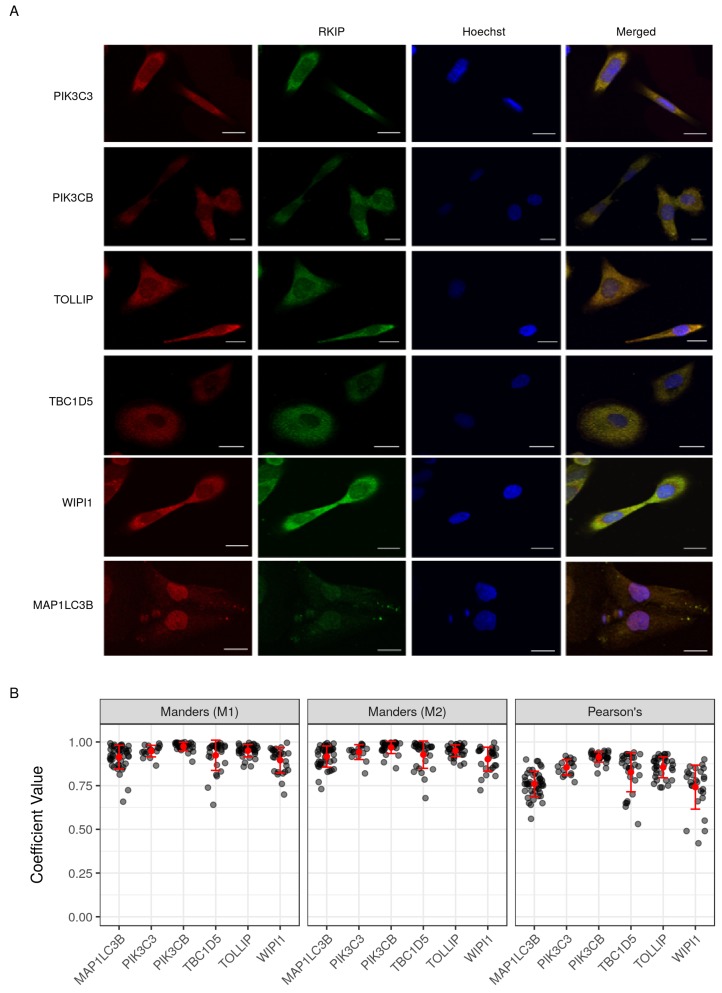
Figure 7.
Co-localization of RKIP/PEBP1 with autophagy-related gene products. (A) immunohistochemistry. Co-localization images between RKIP/PEBP1 and autophagy gene products (PIK3C3, PIK3CB, TOLLIP, TBC1D5, WIPI1 or MAP1LC3B) in human prostate cancer cell line DU145 were obtained from the confocal Olympus FV-1000 microscope (Olympus Corporation, Tokyo, Japan). Nucleus was stained by Hoechst (300 ng/mL). Scale, 10 m; (B) degree of co-localization between RKIP/PEBP1 and binding targets. The graphs (left two M1 and M2) represent the comparative mean Manders’ coefficient. Manders’ M1 and M2 values were taken above the auto-threshold of the green channel or red channel, respectively. The graph (right) shows the Pearson’s correlation coefficient of the co-localization targeted proteins. These values were calculated from variously selected regions of interest (n = 16 to 43).

