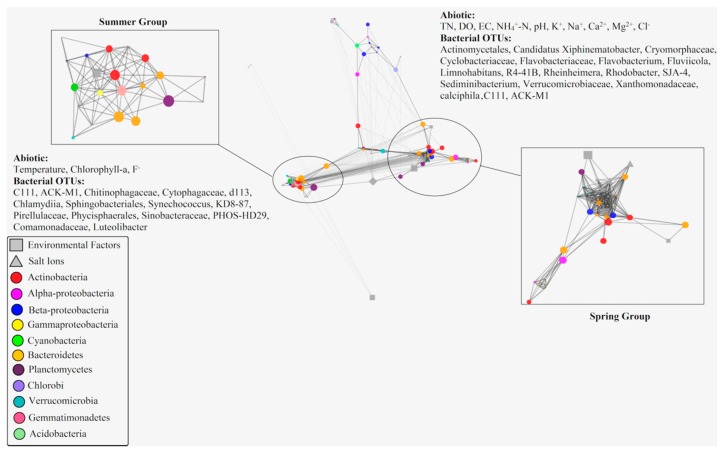
Figure 6.
The edge-weighted spring-embedded network based on the Pearson correlation coefficient reflecting the significant correlations between biotic and abiotic factors (node size has reflected the value of betweenness centrality of the variables. Solid lines represent positive correlations and dashed lines represent negative correlation).

