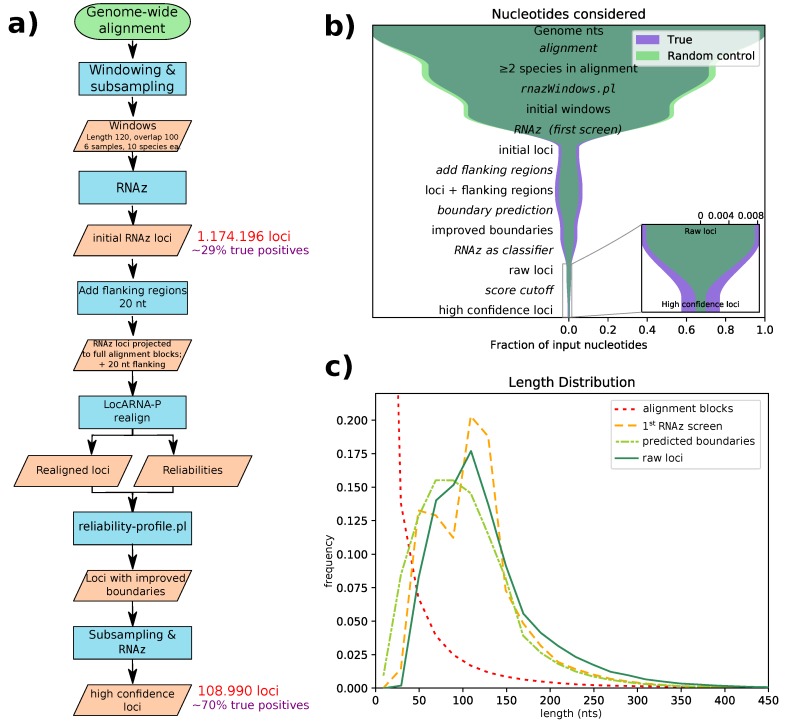
Figure 1.
(a) A flowchart for our computational pipeline. (b) Number of nucleotides considered at every step of the pipeline as a fraction of the number of nucleotides in the genome. The inner (green) funnel is the random control used to estimate the false discovery rate. (c) The length distribution of the alignment blocks (red) and our hits at different points of the pipeline.

