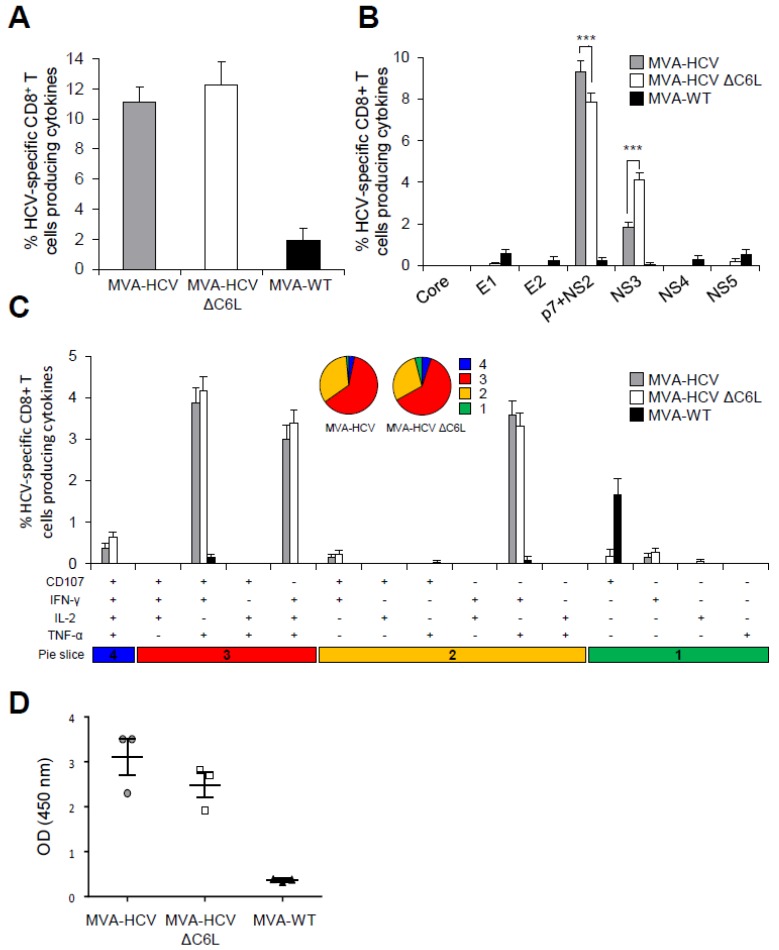
Figure 5.
HCV-specific T cell and humoral adaptive immune responses induced in immunized mice. Splenocytes were obtained from mice (n = 4 per group) immunized with two doses of MVA-WT, MVA-HCV, or MVA-HCV ∆C6L 10 days after the last immunization. Then, HCV-specific CD8+ T cell adaptive immune responses elicited were measured by intracellular cytokine staining (ICS) after stimulation of splenocytes with different HCV peptide pools. Values from unstimulated controls were subtracted in all cases. p values indicate significantly response differences when comparing MVA-HCV with MVA-HCV ΔC6L (*** = p ≤ 0.001). Data is from one experiment representative of four independent experiments. (A) Magnitude of total HCV-specific CD8+ T cell adaptive immune responses directed against HCV antigens. The values represent the sum of the percentages of CD8+ T cells producing CD107a and/or IFN-γ and/or TNF-α and/or IL-2 against Core, E1, E2, p7 + NS2, NS3, NS4, and NS5 peptide pools. (B) Percentages of Core, E1, E2, p7 + NS2, NS3, NS4, or NS5 HCV-specific CD8+ T cells. Frequencies represent the sum of the percentages of CD8+ T cells producing CD107a and/or IFN-γ and/or TNF-α and/or IL-2 against each HCV peptide pool. (C) Polyfunctionality profile of total HCV-specific CD8+ T cell adaptive immune responses directed against HCV antigens and producing CD107a and/or IFN-γ and/or TNF-α and/or IL-2. Responses are grouped and color coded, taking into consideration the number of functions (one, two, three, or four). (D) Humoral immune responses induced by MVA-WT, MVA-HCV, and MVA-HCV ∆C6L against HCV E2 protein. Levels of E2-specific total IgG binding antibodies were measured by ELISA in serum from individually mice immunized with two doses of MVA-WT, MVA-HCV, or MVA-HCV ∆C6L at day 10 after the last immunization. Absorbance values (measured at 450 nm) correspond to 1/100 dilution of individual serum, and each mouse is represented by a dot. The mean ± SD are indicated.

