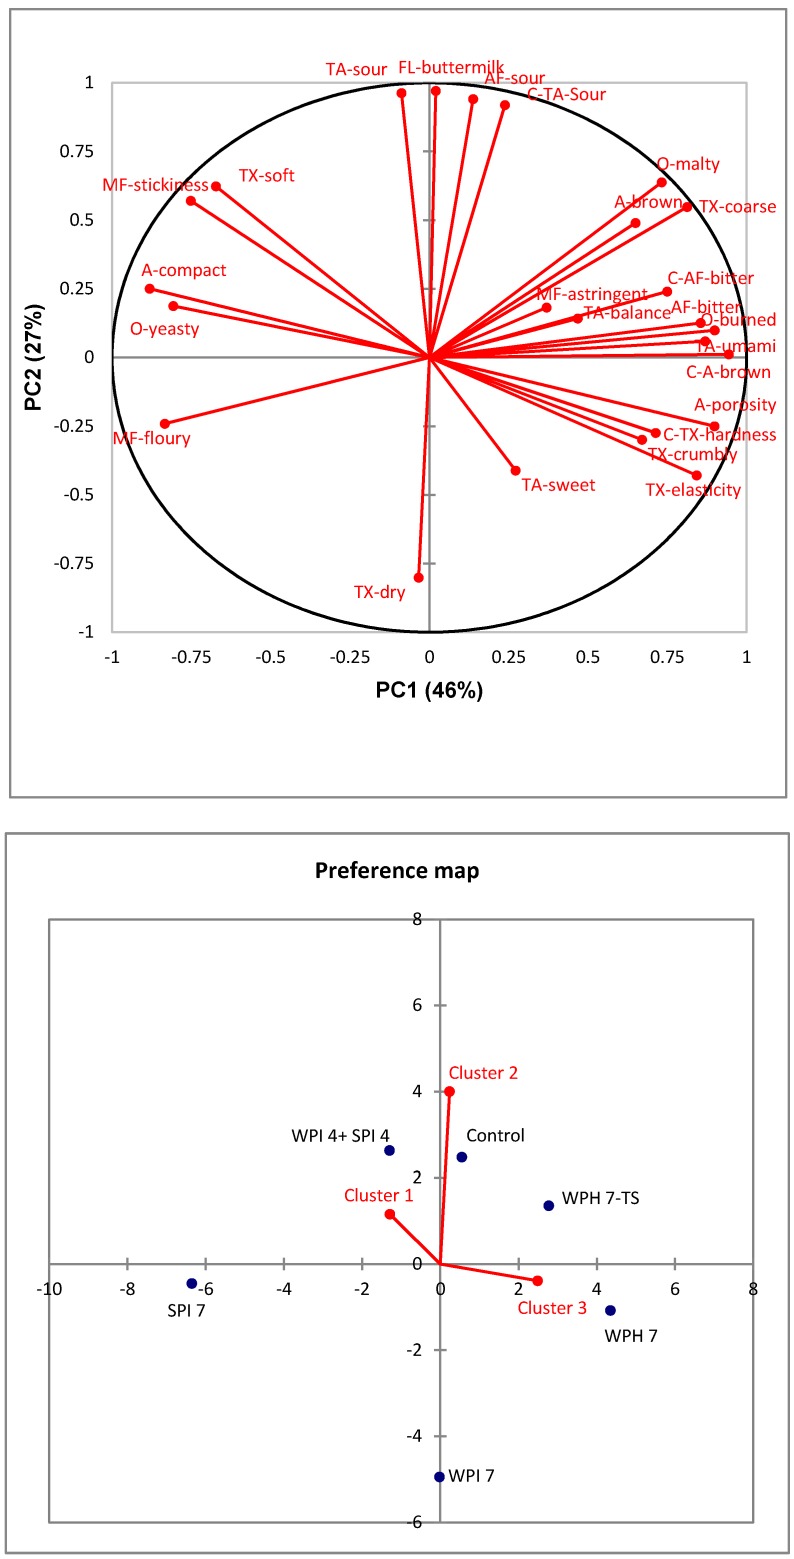
Figure 3.
External preference mapping of rye bread. Red labels: O = odor attributes; A = appearance attributes; TA = taste attributes; TX = texture attributes; FL = flavor attributes; MF = mouthfeel attributes; AF = after-taste attributes. Blue labels: numbers indicate amount of added protein (4 = 4%, and 7 = 7%); TS = texture and taste-modified samples.

