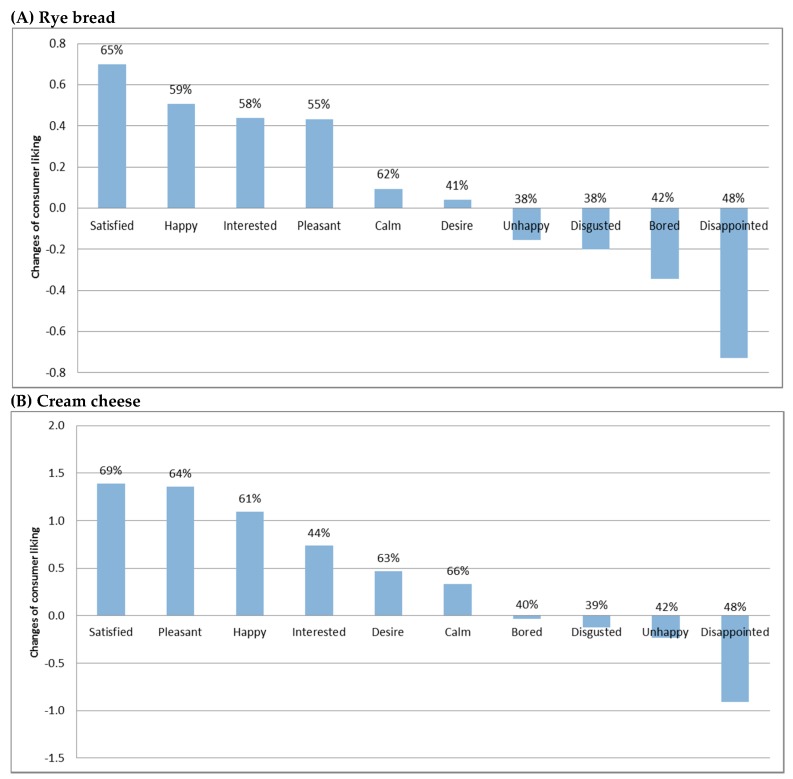
Figure 6.
Penalty-lift analysis of emotions’ effect on overall liking across (A) rye bread samples and (B) cheese samples. The frequency (%) of which the emotion descriptors were checked by consumers is also indicated. The values of the vertical axis indicate the unit of change in liking of prototypes for which the respective emotion attribute was checked, compared to liking of prototypes for which the emotion attribute was not checked. The upstand pillars represent the increase in consumer liking and the downward pillars indicate the decrease in consumer liking.

