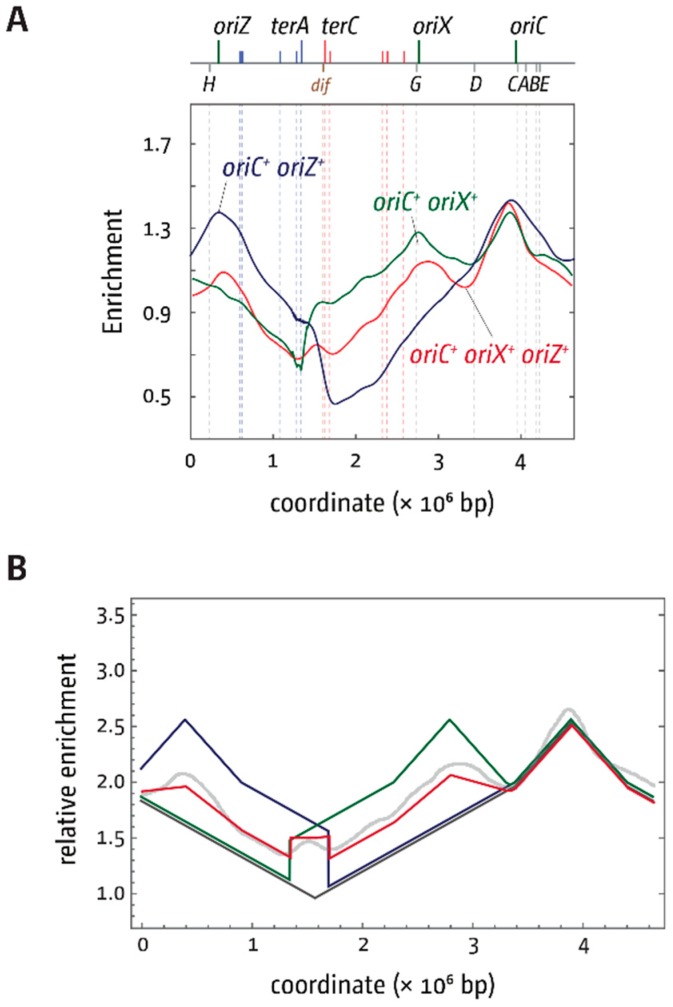
Figure 8.
Comparative analysis of replication profiles of E. coli cells with two and three replication origins. (A) Shown is a combination of the LOESS regression profiles for oriC+ oriZ+ (blue), oriC+ oriX+ (green), and oriC+ oriX+ oriZ+ (red) cells, as shown in Figure 6. (B) Mathematical model fitting for oriC+ oriZ+ (blue), oriC+ oriX+ (green), and oriC+ oriX+ oriZ+ (red) cells. The modelling for oriC+ oriX+ oriZ+ (red) assumes that oriC and oriX are active in 50% of cells, and oriC and oriZ are active in 40% of cells, based on the peak heights in the replication profiles. The LOESS regression curve for oriC+ oriX+ oriZ+ cells is shown in light grey, as shown in Figure 6. See text for further details.

