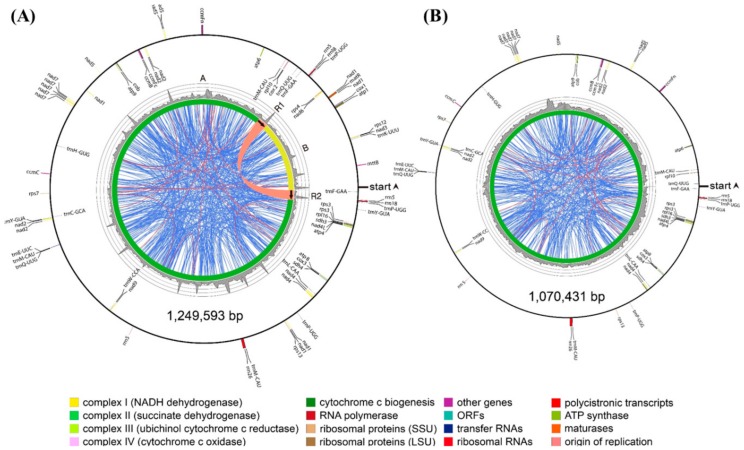
Figure 3.
Maps of the P. grandiflorus mitochondrial genome. (A) Master circle; (B) Minor circle. Direction of gene transcription is represented by the location of the genes on the inside (clockwise) or the outside (counterclockwise) of the outermost circle. Inner histogram indicates average coverage depth of reads mapping to the mitochondrial genome sequence (each grey circle represents 50×, with a maximum of 200×). Innermost circle represents the structural scheme. Repeats of >100 bp are indicated by connecting orange lines and repeats of <100 bp are indicated by connecting blue lines. The thick orange line connects the largest 21.8 kb R1 and R2 repeat regions in the master circle. Tandem repeats are not shown.

