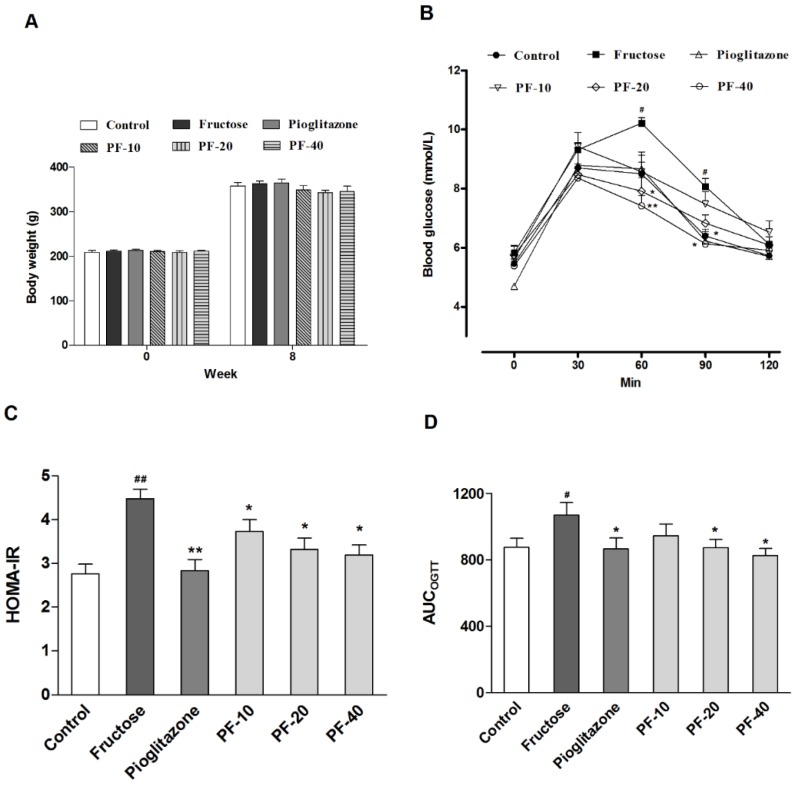
Figure 2.
Effects of paeoniflorin on the body weight and insulin sensitivity in rats. Data are expressed as the mean ± SEM (n = 8). (A) Body weight. (B) The oral glucose tolerance test. (C) The homeostasis model assessment insulin resistance index (HOMA-IR) index. (D) The area under curve during oral glucose tolerance test (OGTT). Data was analyzed by one-way ANOVA followed by Dunnett’s post hoc test. # p < 0.05 and ## p < 0.01 vs. control group. * p < 0.05 and ** p < 0.01 vs. fructose group. PF-10: 10 mg/kg of paeoniflorin; PF-20: 20 mg/kg of paeoniflorin; PF-40: 40 mg/kg of paeoniflorin. HOMA-IR: Homeostasis model assessment insulin resistance index; OGTT: Oral glucose tolerance test; AUC: Area under curve.

