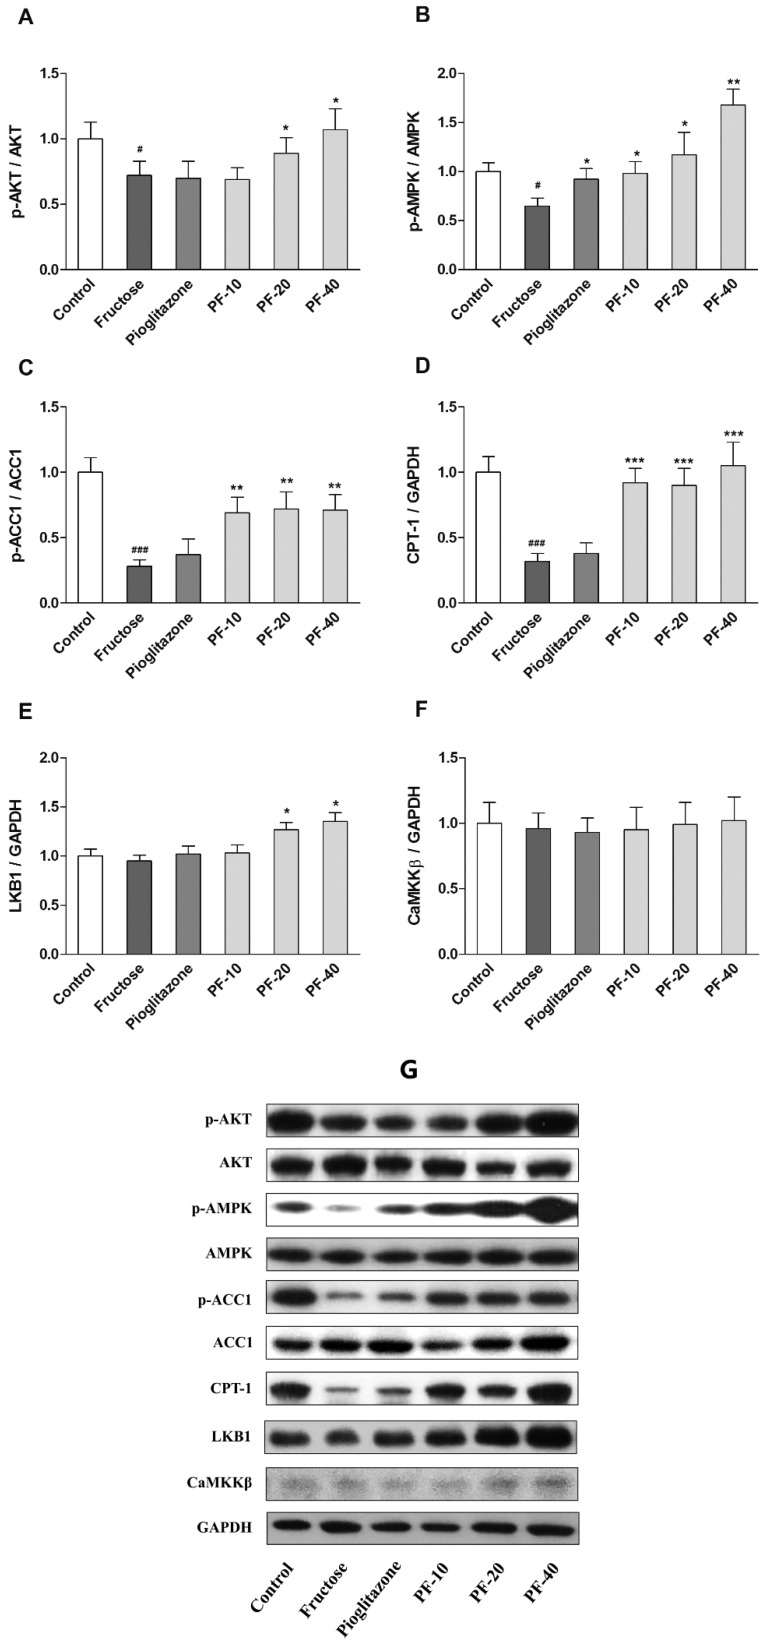
Figure 5.
Effects of paeoniflorin on the body weight and insulin sensitivity in rats. (A) The phosphorylation level of AKT. (B) The phosphorylation level of AMP-activated protein kinase (AMPK). (C) The phosphorylation level of ACC1. (D) The protein expression of CPT-1. (E) The protein expression of LKB1. (F) The protein expression of CaMKKβ. (G) Immunoblot bands. Data were normalized by the abundance of GAPDH and expressed as the relative value to control. Data were expressed as the mean ± SEM (n = 6) and analyzed by one-way ANOVA followed by Dunnett’s post hoc test. # p < 0.05 and ### p < 0.001 vs. control group. * p < 0.05, ** p < 0.01 and *** p < 0.001 vs. fructose group. PF-10: 10 mg/kg of paeoniflorin; PF-20: 20 mg/kg of paeoniflorin; PF-40: 40 mg/kg of paeoniflorin; AKT: Protein kinase B; AMPK: AMP-activated protein kinase; ACC1: Acetyl coenzyme A carboxylase; CPT-1: Carnitine palmitoyltransferase I; GAPDH: Glyceraldehyde-3-phosphate dehydrogenase; LKB1: Tumor suppressor serine/threonine kinase 1; CaMKKβ: Ca2+/CaM-dependent protein kinase kinase β.

