Figure 1.
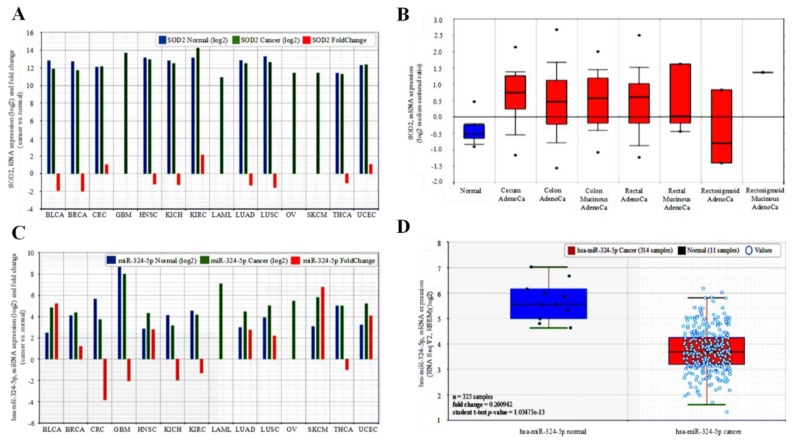
SOD2 is aberrantly expressed in malignancies and correlates with the suppression of hsa-miR-324 expression. (A) Comparative analyses of the SOD2 expression levels in normal–cancer tissue pairs of the TCGA 14 cancer types—pancancer cohort dataset using the starBase v2.0 software algorithms. (B) SOD2 is up-regulated in colon and rectal adenocarcinoma, CRC samples compared to normal samples (fold change = 1.05, student t-test p-value = 0.59432). (C) Comparative analyses of the hsa-miR-324-5p expression levels in normal–cancer tissue pairs of the TCGA 14 cancer type—pancancer cohort dataset. (D) Decreased levels of hsa-miR-324-5p in cancer compared to normal samples (fold change = 0.26, student t-test p-value = 1.035 × 10⁻¹³).

