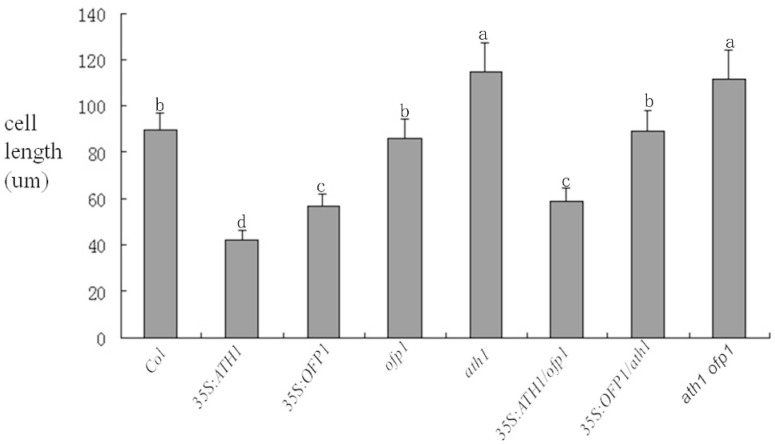
Figure 9.
Lengths of hypocotyl epidermis cells in various mutants (10-day-old seedlings). Different letters represent significant differences among different genetics materials (p < 0.05). The bars represent standard deviations. The 7–10 plants of each genetic type, and a least 10 cells of each plant were analyzed.

