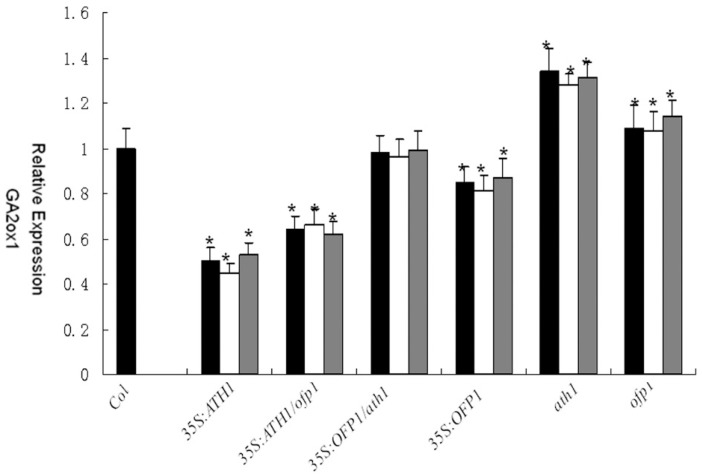
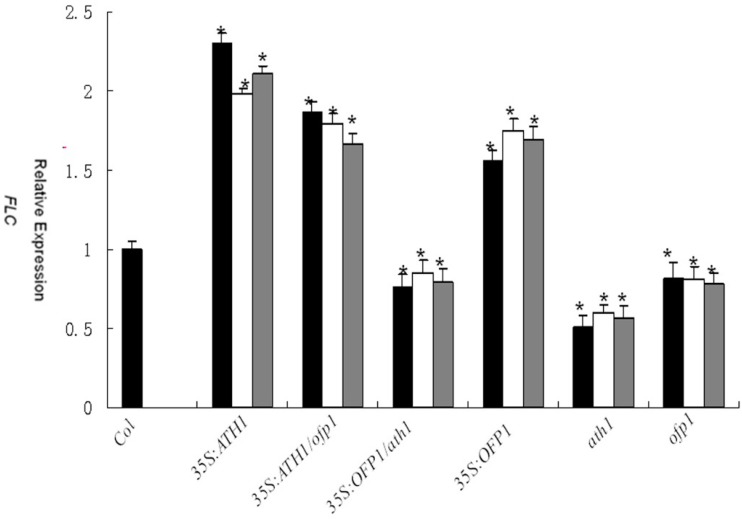
Figure 10.
Analysis of relative expression levels of GA20ox1 and FLC by using quantitative PCR (qPCR) of three transgenic lines of each genotype in 14-day-old seedlings. * indicates significantly different (p < 0.01). The bars represent standard deviations. Data were analyzed using the 2−ΔΔCt method and normalized using the expression of adenine phosphoribosyltransferase (APT).


