. 2018 Apr 26;7(5):848–858. doi: 10.1039/c8tx00100f

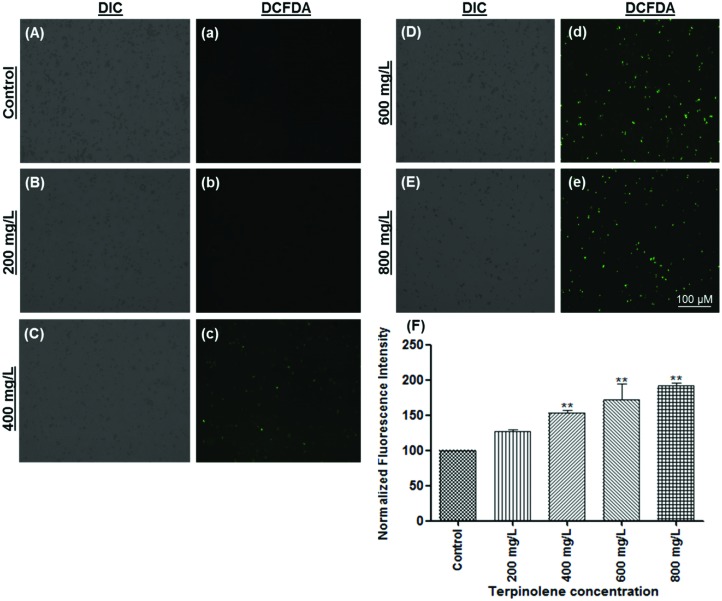
Fig. 5. Measurement of ROS levels using DCFDA (2′,7′-dichlorofluorescin diacetate) staining. ROS generation of cells exposed to 0 (A and a), 200 (B and b), 400 (C and c), 600 (D and d) and 800 (E and e) mg L–1 was visualized and measured by a fluorescence microscope. (F) ROS generation of cells exposed to 0–800 mg L–1 terpinolene was calculated as normalized fluorescence intensity. Values are presented as mean ± SEM. Statistical analysis was made to compare experimental groups and the control group. Significantly different values are indicated by asterisks (One-way ANOVA, **p < 0.01). Images were taken from at least three independent biological replicas (n = 3).

Fig. 5