. 2018 Apr 26;7(5):848–858. doi: 10.1039/c8tx00100f

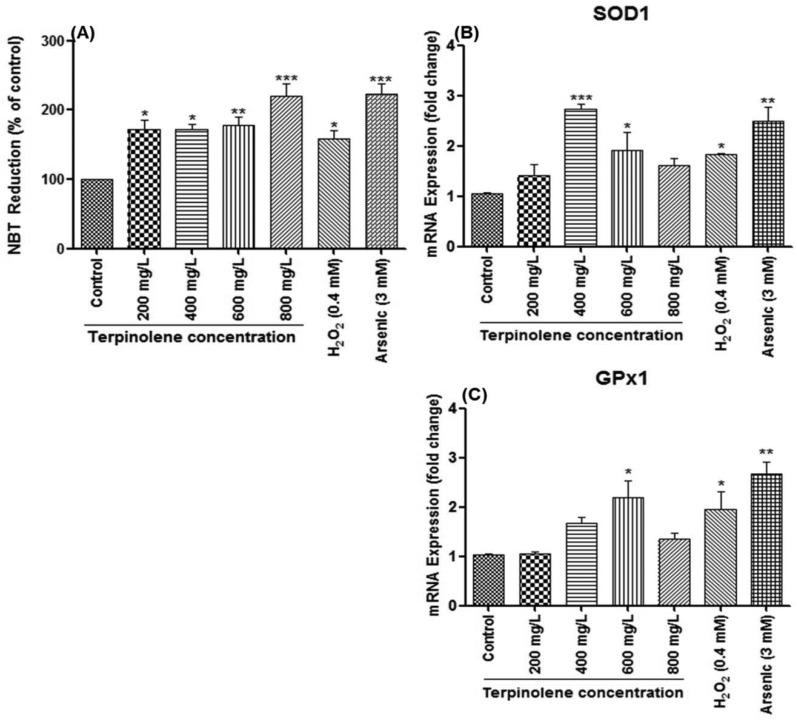
Fig. 6. Cellular ROS levels and gene expression levels of antioxidant enzymes. (A) ROS levels in cells exposed to 0–800 mg L–1 terpinolene were measured by the NBT (3,3′-(3,3′-dimethoxy-4,4′-biphenylene)bis[2-(4-nitrophenyl)-5-phenyl-2H-tetrazolium chloride) assay. ROS generation of cells was determined as absorbance of reduced NBT at 620 nm in a microplate reader and expressed as normalized NBT reduction compared to the control group. (B and C) mRNA levels of SOD1 and GPx1 in cells exposed to 0–800 mg L–1 were measured by RT-PCR. Values are presented as mean ± SEM. Statistical analysis was made to compare experimental groups and the control group. Significantly different values are indicated by asterisks (One-way ANOVA, *p < 0.05, **p < 0.01, ***p < 0.001). Values were taken from at least three independent biological replicas (n = 3).

Fig. 6