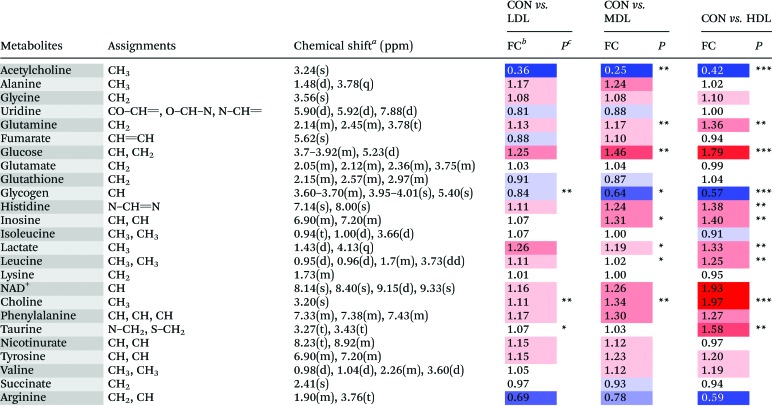
Table 2. Metabolites identified from the aqueous liver extracts, and their fold change values versus the control group.

|
aMultiplicity: s, singlet; d, double; t, triplet; q, quartets; m, multiplet.
bFC, fold change = C-dot injected samples/control samples; color coded according to the log2(FC) using color bar  , red denotes the increase and blue the decrease in C-dots injected groups.
c P values corrected by the BH (Benjamini–Hochberg) methods were calculated based on a parametric Student's t-test or a nonparametric Mann–Whitney test. *P < 0.05, **P < 0.01, ***P < 0.001.
