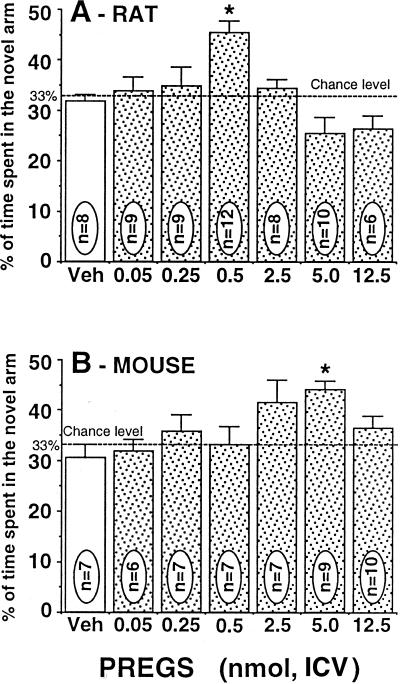
Figure 1.
Dose–response curves of PREGS administered ICV on the retention performances of rats (A) and mice (B) tested in the Y-maze. Data were expressed as the percentage of time spent in the novel arm relative to the total duration of visits in the three arms during the first 3 min of the test (mean ± SEM). *, P < 0.05 vs. vehicle group, Newman–Keuls test. Veh, vehicle.

