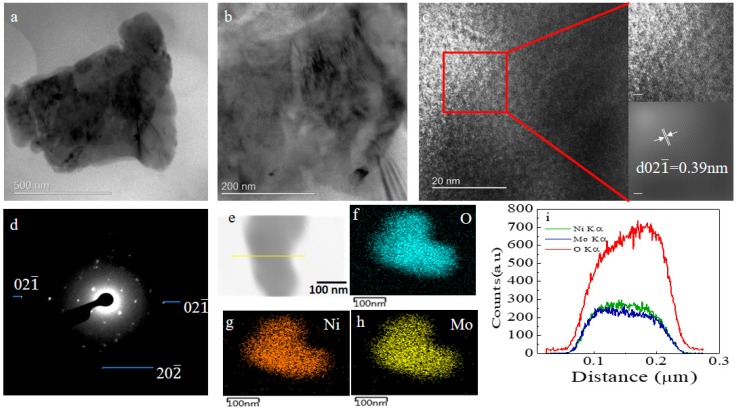
Figure 2.
The transmission electron microscope (TEM) image for a single NiMoO4 nanograin grown for 18 h at (a) low and (b) high magnification; (c) The high resolution transmission electron microscope (HRTEM) image with d spacing noted; (d) The selected area diffraction (SAED) pattern of the same sample showing respective planes. High angle annular dark field imaging scanning transmission electron microscope (HAADF-STEM) elemental mapping for a selected area showing (e) the electron with line mapping; (f) oxygen; (g) nickel; (h) molybdenum; and (i) line mapping, showing the counts of Mo, Ni, and O.

