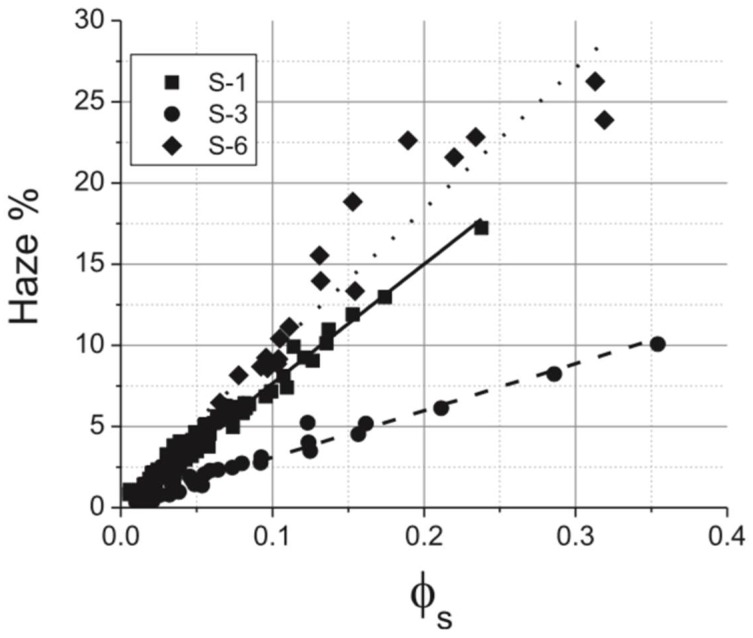
Figure 3.
Optical haze versus silver area coverage /s for nanowires S-1 (100 nm), S-3 (56 nm), and S-6 (153 nm). Calculated curves are shown as (_____, S-1), (- - - - , S-3) and (........., S-6). Reprinted from [19], with permission from AIP Publishing, 2013.

