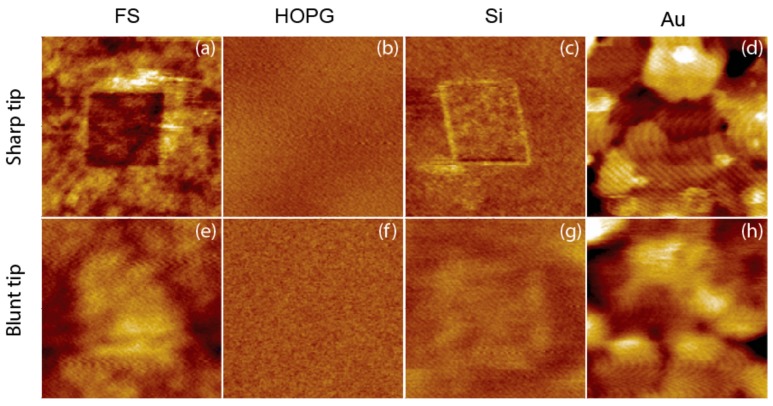
Figure 6.
1 × 1 µm AFM height images of materials recorded after QNM measurements in 400 nm squares with sharp and blunt tips, using the loading forces specified in Figure 5 for each tip and material combination. (a–d) are images from the sharp tip, and (e–h) are images from the blunt tip. Resolution is 128 × 128, Z range is 4 nm for Au and 2 nm for FS, HOPG and Si.

