Fig. 5.
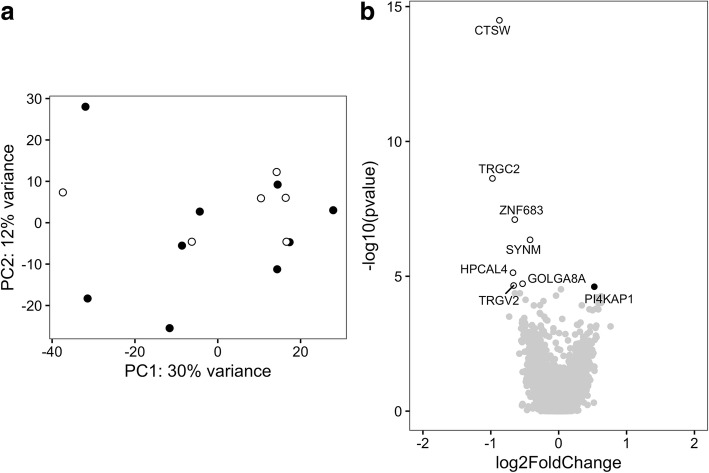
Gene expression profile in CD4+ T cells of HLA-DRB1*03-positive and -negative patients with myositis. a Principal components (PCs) 1 and 2 plotted according to the HLA-DRB1*03 status of the patients in a dataset of 21,008 genes (n = 15). Samples from HLA-DRB1*03-positive patients with myositis are represented by filled circles, and those from HLA-DRB1*03-negative patients with myositis are represented by open circles. b Differential genome-wide transcriptomic profile in CD4+ T cells for the contrast between HLA-DRB1*03-positive and -negative patients with myositis. The fold changes (log2) are shown on the x-axis, and the p values (−log10) are shown on the y-axis. The genes that are expressed significantly higher in HLA-DRB1*03-positive myositis are shown by filled circles, and the genes expressed significantly higher in HLA-DRB1*03-negative myositis are shown by open circles. A false discovery rate threshold of 5% based on the method of Benjamini-Hochberg was used to identify significant differentially expressed genes

